
Archived Content
Information identified as archived is provided for reference, research or recordkeeping purposes. It is not subject to the Government of Canada Web Standards and has not been altered or updated since it was archived. Please contact us to request a format other than those available.
NHS Focus on Geography Series – Nunavut
Aboriginal Peoples
Demographic characteristics of Aboriginal people
In 2011, 86.3% (27,360) of the population of Nunavut had an Aboriginal identity.Aboriginal Peoples Footnote 1 Of those, 0.5% (130) reported a First Nations identityAboriginal Peoples Footnote 2 only, 0.5% (130) reported a Métis identity only and 98.9% (27,070) reported an Inuit identity only. An additional 15, or 0.1%, reported other Aboriginal identities and 20, or 0.1%, reported more than one Aboriginal identity.
Table 1 – Population by Aboriginal identity, Nunavut, Canada
Table summary
This table presents the population by Aboriginal identity. The column headings are: population; Nunavut and Canada. The columns Nunavut and Canada are divided into number, percentage of total population and percentage of Aboriginal identity population. The rows are: total population; Aboriginal identity population; First Nations single identity; First Nations single identity (Registered or Treaty Indian); First Nations single identity (not a Registered or Treaty Indian); Métis single identity; Inuit single identity; multiple Aboriginal identities; Aboriginal identities not included elsewhere; non-Aboriginal identity population.
| Population | Nunavut | Canada | ||||
|---|---|---|---|---|---|---|
| Number | % of total population | % of Aboriginal identity population | Number | % of total population | % of Aboriginal identity population | |
| Total population in private households | 31,695 | 100.0 | ... | 32,852,325 | 100.0 | ... |
| Aboriginal identity population | 27,360 | 86.3 | 100.0 | 1,400,685 | 4.3 | 100.0 |
| First Nations single identity | 130 | 0.4 | 0.5 | 851,560 | 2.6 | 60.8 |
| First Nations single identity (Registered or Treaty Indian) | 85 | 0.3 | 0.3 | 637,660 | 1.9 | 45.5 |
| First Nations single identity (not a Registered or Treaty Indian) | 40 | 0.1 | 0.1 | 213,900 | 0.7 | 15.3 |
| Métis single identity | 130 | 0.4 | 0.5 | 451,790 | 1.4 | 32.3 |
| Inuit single identity | 27,070 | 85.4 | 98.9 | 59,440 | 0.2 | 4.2 |
| Multiple Aboriginal identities | 20 | 0.1 | 0.1 | 11,415 | 0.0 | 0.8 |
| Aboriginal identities not included elsewhere | 15 | 0.0 | 0.1 | 26,475 | 0.1 | 1.9 |
| Non-Aboriginal identity population | 4,340 | 13.7 | ... | 31,451,635 | 95.7 | ... |
In Nunavut, the Aboriginal population is younger than the non-Aboriginal population. In 2011, the median age of the Aboriginal population was 21.3 years compared to 38.8 for the non-Aboriginal population. The median age is the age where exactly one-half of the population is older and the other half is younger.
The median age and age distribution of First Nations people, Métis and Inuit are shown in table 2.
Table 2 – Age distribution and median age by Aboriginal identity, Nunavut, Canada
Table summary
This table presents the population by Aboriginal identity and distribution by various age groups, as well as the median age. The column headings are: population; Nunavut and Canada. The columns Nunavut and Canada are divided into percent distribution by age groups and median age (years). The column percent distribution by age groups is further divided into: total - age groups; 0 to 14 years; 15 to 24 years; 25 to 64 years and 65 years and over. The rows are: total population; Aboriginal identity population; First Nations single identity; First Nations single identity (Registered or Treaty Indian); First Nations single identity (not a Registered or Treaty Indian); Métis single identity; Inuit single identity; multiple Aboriginal identities; Aboriginal identities not included elsewhere; non-Aboriginal identity population.
| Population | Nunavut | Canada | ||||||||||
|---|---|---|---|---|---|---|---|---|---|---|---|---|
| Total – Age groups | 0 to 14 years | 15 to 24 years | 25 to 64 years | 65 years and over | Median age | Total – Age groups | 0 to 14 years | 15 to 24 years | 25 to 64 years | 65 years and over | Median age | |
| Percentage (%) distribution by age groups | years | Percentage (%) distribution by age groups | years | |||||||||
| Total population in private households | 100.0 | 33.0 | 18.8 | 45.1 | 3.2 | 24.0 | 100.0 | 17.0 | 13.2 | 56.0 | 13.9 | 40.1 |
| Aboriginal identity population | 100.0 | 36.4 | 20.6 | 39.7 | 3.3 | 21.3 | 100.0 | 28.0 | 18.2 | 47.9 | 5.9 | 27.7 |
| First Nations single identity | 100.0 | 23.1 | 19.2 | 57.7 | 0.0 | 28.1 | 100.0 | 30.4 | 18.4 | 45.7 | 5.5 | 25.9 |
| First Nations single identity (Registered or Treaty Indian) | 100.0 | 29.4 | 17.6 | 58.8 | 0.0 | 26.8 | 100.0 | 30.7 | 18.6 | 45.4 | 5.3 | 25.5 |
| First Nations single identity (not a Registered or Treaty Indian) | 100.0 | 25.0 | 0.0 | 62.5 | 0.0 | 42.8 | 100.0 | 29.4 | 17.9 | 46.5 | 6.2 | 27.0 |
| Métis single identity | 100.0 | 11.5 | 11.5 | 73.1 | 0.0 | 35.1 | 100.0 | 23.1 | 17.7 | 52.6 | 6.6 | 31.4 |
| Inuit single identity | 100.0 | 36.6 | 20.7 | 39.4 | 3.3 | 21.2 | 100.0 | 33.9 | 20.1 | 41.9 | 4.1 | 22.8 |
| Multiple Aboriginal identities | 100.0 | 50.0 | 0.0 | 0.0 | 0.0 | 20.8 | 100.0 | 32.7 | 17.5 | 44.2 | 5.7 | 24.9 |
| Aboriginal identities not included elsewhere | 100.0 | 0.0 | 0.0 | 66.7 | 0.0 | 33.9 | 100.0 | 18.9 | 13.8 | 54.8 | 12.5 | 39.4 |
| Non-Aboriginal identity population | 100.0 | 10.9 | 7.6 | 78.6 | 2.9 | 38.8 | 100.0 | 16.5 | 12.9 | 56.3 | 14.2 | 40.6 |
Living arrangements of Aboriginal children
In Nunavut, 66.5% of Aboriginal children aged 14 and under lived in a familyAboriginal Peoples Footnote 3 with both their parents (biological or adoptive) and 23.2% lived in a lone-parent family.Aboriginal Peoples Footnote 4 Another 5.4% were stepchildren,Aboriginal Peoples Footnote 5 2.4% were grandchildren living in a skip-generation family,Aboriginal Peoples Footnote 6 1.3% were foster childrenAboriginal Peoples Footnote 7 and 1.2% were children living with other relatives.
Living arrangements of First Nations, Métis and Inuit children aged 14 and under are illustrated in table 3.
Table 3 – Percentage distribution of the population aged 14 and under by living arrangement for selected Aboriginal identity categories, Nunavut
Table summary
This table presents the percentage distribution of the population aged 14 and under by living arrangement for selected Aboriginal identity categories. The column headings are: living arrangements; percentage distribution of the population for: total Aboriginal identity population; First Nations single identity; Métis single identity; Inuit single identity; non-Aboriginal identity population. The rows are: total population aged 14 and under; children of both parents; stepchildren; children of lone parent; of male lone parent; of female lone parent; grandchildren in skip-generation family; foster children; children living with other relatives.
| Living arrangements | Total Aboriginal identity population | First Nations single identity | Métis single identity | Inuit single identity | Non-Aboriginal identity population |
|---|---|---|---|---|---|
| Percentage (%) distribution of the population | |||||
Table note(s):
|
|||||
| Total population aged 14 and under | 100.0 | 100.0 | 100.0 | 100.0 | 100.0 |
| Children of both parentsTable 3 Footnote 1 | 66.5 | 66.7 | 100.0 | 66.5 | 85.3 |
| Stepchildren | 5.4 | 0.0 | 0.0 | 5.3 | 3.2 |
| Children of lone parent | 23.2 | 33.3 | 0.0 | 23.2 | 12.6 |
| Of male lone parent | 5.9 | 0.0 | 0.0 | 5.9 | 4.2 |
| Of female lone parent | 17.4 | 0.0 | 0.0 | 17.3 | 7.4 |
| Grandchildren in skip-generation family | 2.4 | 0.0 | 0.0 | 2.4 | 0.0 |
| Foster children | 1.3 | 0.0 | 0.0 | 1.3 | 0.0 |
| Children living with other relativesTable 3 Footnote 2,Table 3 Footnote 3 | 1.2 | 0.0 | 0.0 | 1.2 | 0.0 |
Language and Aboriginal peoples
In Nunavut, 24,255 Aboriginal people, or 88.7% of the population who had an Aboriginal identity, responded that they were able to conduct a conversation in an Aboriginal language. In 2011, the Aboriginal languages most frequently reported by Aboriginal people were: Inuktitut (23,480), Inuinnaqtun (540) and Innu/Montagnais (75).
In 2011, 79.7% of the Aboriginal identity population reported an Aboriginal language as mother tongue, defined as the first language learned at home in childhood and still understood.
As well, 84.3% of Aboriginal people reported speaking an Aboriginal language at home: 60.7% spoke it most often while another 23.7% spoke it on a regular basis.
Linguistic characteristics of First Nations people, Métis and Inuit are shown in tables 4 to 6.
Table 4 – Number and proportion of Aboriginal identity population, First Nations people, Métis and Inuit for selected Aboriginal language indicators, Nunavut
Table summary
This table presents number and proportion of Aboriginal identity population, First Nations people, Métis and Inuit for selected Aboriginal language indicators. The column headings are: selected Aboriginal language indicators; total Aboriginal identity population; First Nations single identity; Métis single identity; Inuit single identity. The last four columns are divided into number and percentage of population. The rows are: ability to conduct a conversation in an Aboriginal language; Aboriginal language as mother tongue; Aboriginal language spoken at least regularly at home; Aboriginal language spoken most often at home; Aboriginal language spoken regularly at home.
| Selected Aboriginal language indicators | Total Aboriginal identity population | First Nations single identity | Métis single identity | Inuit single identity | ||||
|---|---|---|---|---|---|---|---|---|
| numberTable 4 Footnote 1 | % of population | number | % of population | number | % of population | number | % of population | |
Table note(s):
|
||||||||
| Ability to conduct a conversation in an Aboriginal language | 24,255 | 88.7 | 45 | 34.6 | 25 | 19.2 | 24,165 | 89.3 |
| Aboriginal language as mother tongue | 21,815 | 79.7 | 25 | 19.2 | 15 | 11.5 | 21,770 | 80.4 |
| Aboriginal language spoken at least regularly at home | 23,070 | 84.3 | 25 | 19.2 | 20 | 15.4 | 23,005 | 85.0 |
| Aboriginal language spoken most often at home | 16,595 | 60.7 | 10 | 7.7 | 10 | 7.7 | 16,560 | 61.2 |
| Aboriginal language spoken regularly at homeTable 4 Footnote 2 | 6,475 | 23.7 | 15 | 11.5 | 15 | 11.5 | 6,445 | 23.8 |
In Nunavut, 88.7% of the Aboriginal identity population reported that they were able to conduct a conversation only in English or only in French. Additionally, 0.9% of Aboriginal people reported that they were able to conduct a conversation in both of Canada's official languages. The other 10.5%, or 2,860, reported that they were not able to conduct a conversation in either of these two languages.
Table 5 – Percentage distribution of the population by knowledge of official languages for selected Aboriginal identity categories, Nunavut
Table summary
This table presents the percentage distribution of the population by knowledge of official languages for selected Aboriginal identity categories. The column headings are: knowledge of official languages; percentage distribution of the population for: total Aboriginal identity population; First Nations single identity; Métis single identity; Inuit single identity; non-Aboriginal identity population. The rows are: total population; English only; French only; English and French; neither English nor French.
| Knowledge of official languages | Total Aboriginal identity population | First Nations single identity | Métis single identity | Inuit single identity | Non-Aboriginal identity population |
|---|---|---|---|---|---|
| Percentage (%) distribution of the population | |||||
| Total population in private households | 100.0 | 100.0 | 100.0 | 100.0 | 100.0 |
| English only | 88.6 | 84.6 | 76.9 | 88.7 | 77.5 |
| French only | 0.1 | 0.0 | 0.0 | 0.1 | 0.3 |
| English and French | 0.9 | 15.4 | 23.1 | 0.7 | 21.8 |
| Neither English nor French | 10.5 | 0.0 | 0.0 | 10.6 | 0.2 |
In Nunavut, among the 24,255 Aboriginal people who reported being able to conduct a conversation in an Aboriginal language, 88.8% reported that same language as their mother tongue. The other 11.2% reported a different language, such as English or French, as mother tongue, which suggests these individuals have acquired an Aboriginal language as a second language.
On the other hand, among the 21,815 Aboriginal people who reported an Aboriginal language as mother tongue, 1.3% could no longer conduct a conversation in this language, despite the fact that they still understand it.
Table 6 – Population who reported an ability to conduct a conversation in an Aboriginal language that is not their mother tongue and population who reported an Aboriginal mother tongue but who could not conduct a conversation in that language, for selected Aboriginal identity categories, Nunavut
Table summary
This table presents the population who reported an ability to conduct a conversation in an Aboriginal language that is not their mother tongue and the population who reported an Aboriginal mother tongue but who could not conduct a conversation in that language, for selected Aboriginal identity categories. The column headings are: selected Aboriginal identity categories; persons reporting an ability to conduct a conversation in an Aboriginal language that is not their mother tongue; persons reporting an Aboriginal mother tongue but who could not conduct a conversation in that language. The last two columns are divided into number and percentage of population. The rows are: total Aboriginal identity population; First Nations single identity; Métis single identity; Inuit single identity; non-Aboriginal identity population.
| Selected Aboriginal identity categories | Persons reporting an ability to conduct a conversation in an Aboriginal language that is not their mother tongue | Persons reporting an Aboriginal mother tongue but who could not conduct a conversation in that language | ||
|---|---|---|---|---|
| numberTable 6 Footnote 1 | % of population | numberTable 6 Footnote 1 | % of population | |
Table note(s):
|
||||
| Total Aboriginal identity population | 2,715 | 11.2 | 285 | 1.3 |
| First Nations single identity | 20 | 44.4 | 0 | 0.0 |
| Métis single identity | 10 | 40.0 | 0 | 0.0 |
| Inuit single identity | 2,680 | 11.1 | 280 | 1.3 |
| Non-Aboriginal identity population | 235 | 72.3 | 10 | 9.5 |
Note(s):
- Footnote 1
-
Aboriginal identity: The term 'Aboriginal identity' refers to whether the person reported being an Aboriginal person, that is, First Nations (North American Indian), Métis or Inuk (Inuit) and/or being a Registered or Treaty Indian, (that is, registered under the Indian Act of Canada) and/or being a member of a First Nation or Indian band. Aboriginal peoples of Canada are defined in the Constitution Act, 1982, section 35 (2) as including the Indian, Inuit and Métis peoples of Canada.
- Footnote 2
-
Respondents self-identified as 'First Nations (North American Indian)' on the NHS questionnaire; however, the term 'First Nations people' is used throughout this document.
- Footnote 3
-
Family: The term 'family' in this document refers to the census definition of 'census family,' but for simplicity, the term 'family' is used throughout this report. A census family is composed of a married or common-law couple, with or without children, or of a lone parent living with at least one child in the same dwelling. Couples can be of the opposite sex or of the same sex.
- Footnote 4
-
Lone parents: Mothers or fathers, with no married spouse or common-law partner present, living in a dwelling with one or more children.
- Footnote 5
-
Stepchild: A stepchild is a child in a couple family who is the biological or adopted child of only one married spouse or common-law partner in the couple, and whose birth or adoption preceded the current relationship.
- Footnote 6
-
Skip-generation family: A census family that consists of grandparents and grandchildren without the presence of parents in the home.
- Footnote 7
-
Foster children: The population in private households who have been reported as foster children on the NHS questionnaire. Foster children are considered as 'other relatives' outside of a census family.
Immigration and Ethnocultural Diversity
Immigrant population
According to the 2011 National Household Survey (NHS), 615 (1.9%) of the population of Nunavut were foreign-born (immigrants), 31,025 (97.9%) were Canadian-born (non-immigrants) and 60 (0.2%) were non-permanent residents.Ethnocultural Footnote 1 In comparison, the proportion of the population of Canada who were immigrants was 20.6%, 78.3% were non-immigrants, and 1.1% were non-permanent residents.
Figure 1 Percentage of Canadian born (non-immigrants), foreign born (immigrants) and non permanent residents in Nunavut
Figure description
This vertical bar graph shows the percentage of Canadian born (non-immigrants), foreign born (immigrants) and non-permanent residents. The y-axis is the percentage of population and the x-axis, from left to right, shows Canadian born (non-immigrants), foreign born (immigrants) and non-permanent residents.

Of the immigrants living in Nunavut in 2011, 130 came to Canada between 2006 and 2011. These recent immigrants made up 21.1% of the immigrants in the territory.
The three most common countries of birth of immigrants living in Nunavut were: United Kingdom (accounting for 16.3% of the immigrant population in Nunavut), Philippines (16.3%) and United States (10.6%). In comparison, the top three countries of birth of immigrants living in Canada were: India (accounting for 8.1% of the immigrant population in Canada), China (8.1%) and United Kingdom (7.9%).
Table 1 – Immigrants by country of birth, Nunavut, Canada
Table summary
This table shows the most common countries of birth of immigrants. The column headings are: immigrants by country of birth along with the selected geography showing both numbers and percentages. The rows are: total immigrants and the most common countries of birth of immigrants.
| Immigrants by country of birth | Nunavut | Canada | ||||
|---|---|---|---|---|---|---|
| Count | % | Rank | Count | % | Rank | |
| Total immigrants | 615 | 100.0 | ... | 6,775,765 | 100.0 | ... |
| United Kingdom | 100 | 16.3 | 1 | 537,040 | 7.9 | 3 |
| Philippines | 100 | 16.3 | 1 | 454,335 | 6.7 | 4 |
| United States | 65 | 10.6 | 3 | 263,475 | 3.9 | 5 |
In 2011, among Nunavut's immigrant population, 80.5% spoke English and/or French most often at home. Meanwhile, the two most frequently reported non-official languages spoken most often at home by immigrants in Nunavut were Tagalog (Pilipino,Filipino) and Spanish. This compared to the top three non-official languages in Canada, which were Cantonese, Panjabi (Punjabi) and Chinese, n.o.s..Ethnocultural Footnote 2
Table 2 – Immigrants by non-official languages spoken most often at home, Nunavut, Canada
Table summary
This table presents the most common non-official language spoken most often at home for immigrants. The column headings are: immigrants by non-official language spoken most often at home with the selected geography showing both numbers and percentages. The rows are: the most common non-official language spoken most often at home.
| Immigrants by non-official language spoken most often at homeEthnocultural Footnote 2 | Nunavut | Canada | ||||
|---|---|---|---|---|---|---|
| Count | % | Rank | Count | % | Rank | |
| Tagalog (Pilipino,Filipino) | 50 | 8.1 | 1 | 257,000 | 3.8 | 4 |
| Spanish | 15 | 2.4 | 2 | 220,720 | 3.3 | 5 |
The median age of immigrants in Nunavut was 46.9 years in 2011, compared to 47.4 years for the immigrant population at the national level.
Visible minority population and ethnic origins
The 2011 NHS estimated that 515 individuals in Nunavut belonged to a visible minority group, accounting for 1.6% of its total population.Ethnocultural Footnote 1 In comparison, visible minorities comprised 19.1% of Canada's population.
The largest visible minority groups living in Nunavut were Filipino, Black and South Asian. In Canada, the three largest visible minority groups were South Asian, Chinese and Black.
The median age of the visible minority population in Nunavut was 38.4 years in 2011, compared to 33.4 years for the visible minority population at the national level.
Table 3 – Population showing visible minority groups, Nunavut, Canada
Table summary
This table shows the population by visible minority groups. The column headings are: population showing visible minority groups along with the selected geography showing both numbers and percentages. The rows are: total population; total visible minority population; South Asian; Chinese; Black; Filipino; Latin American; Arab; Southeast Asian; West Asian; Korean; Japanese; visible minority, n.i.e., multiple visible minorities and not a visible minority.
| Population showing visible minority groups | Nunavut | Canada | ||
|---|---|---|---|---|
| Count | % | Count | % | |
| Total population in private households | 31,695 | 100.0 | 32,852,320 | 100.0 |
| Total visible minority population | 515 | 1.6 | 6,264,750 | 19.1 |
| South Asian | 95 | 0.3 | 1,567,400 | 4.8 |
| Chinese | 65 | 0.2 | 1,324,750 | 4.0 |
| Black | 120 | 0.4 | 945,665 | 2.9 |
| Filipino | 130 | 0.4 | 619,310 | 1.9 |
| Latin American | 30 | 0.1 | 381,280 | 1.2 |
| Arab | 15 | 0.0 | 380,620 | 1.2 |
| Southeast Asian | 30 | 0.1 | 312,080 | 0.9 |
| West Asian | 10 | 0.0 | 206,840 | 0.6 |
| Korean | 10 | 0.0 | 161,125 | 0.5 |
| Japanese | 10 | 0.0 | 87,265 | 0.3 |
| Visible minority, n.i.e. | 10 | 0.0 | 106,475 | 0.3 |
| Multiple visible minorities | 10 | 0.0 | 171,935 | 0.5 |
| Not a visible minority | 31,185 | 98.4 | 26,587,575 | 80.9 |
The most frequently reported ethnic origins in Nunavut, for people reporting either one or multiple ethnic origins, were Inuit, Scottish and English. This compared to the top three in Canada, which were Canadian, English and French.
Table 4 – Most frequently reported ethnic origins, Nunavut and Canada
Table summary
This table shows the most common ethnic origins. The column headings are: ethnic origin along with the selected geography showing both numbers and percentages. The rows are: the most common ethnic origins.
| Most frequently reported ethnic origins | Nunavut | Canada | ||||
|---|---|---|---|---|---|---|
| Count | % | Rank | Count | % | Rank | |
| Inuit | 27,080 | 85.4 | 1 | 72,610 | 0.2 | 55 |
| Scottish | 2,420 | 7.6 | 2 | 4,714,970 | 14.4 | 4 |
| English | 1,730 | 5.5 | 3 | 6,509,500 | 19.8 | 2 |
Religion
According to the 2011 NHS, 87.1% of the population in Nunavut reported a religious affiliation, while 12.9% said they had no religious affiliation.Ethnocultural Footnote 1 At the national level, 76.1% of the population reported a religious affiliation, while 23.9% had no religious affiliation.
The most frequently reported religious affiliation in Nunavut was Anglican, reported by 15,940 (50.3%) of the population. Other frequently reported religions included: Roman Catholic (23.9%) and Pentecostal (4.9%). In comparison, the most frequently reported religions in Canada were: Roman Catholic (reported by 38.7% of the population of Canada), United Church (6.1%) and Anglican (5.0%).
Table 5 – Most frequently reported religions, Nunavut, Canada
Table summary
This table shows the most common religions. The column headings are: religion along with the selected geography showing both numbers and percentages. The rows are: the most common religions.
| Most frequently reported religions | Nunavut | Canada | ||||
|---|---|---|---|---|---|---|
| Count | % | Rank | Count | % | Rank | |
| Total population in private households | 31,695 | 100.0 | ... | 32,852,320 | 100.0 | ... |
| Total reporting a religious affiliation | 27,595 | 87.1 | ... | 25,001,715 | 76.1 | ... |
| Anglican | 15,940 | 50.3 | 1 | 1,631,850 | 5.0 | 3 |
| Roman Catholic | 7,580 | 23.9 | 2 | 12,728,880 | 38.7 | 1 |
| Pentecostal | 1,555 | 4.9 | 3 | 478,705 | 1.5 | 9 |
| Total not reporting a religious affiliation | 4,100 | 12.9 | ... | 7,850,610 | 23.9 | ... |
Note(s):
- Footnote 1
-
For details on the concepts, definitions, universes, variables and geographic terms used in the 2011 National Household Survey, please consult the National Household Survey Dictionary, Catalogue no. 99-000-X. For detailed explanations on concepts and for information on data quality, please refer to the reference guides found on the NHS website.
- Footnote 2
-
These counts include both single non-official language responses and multiple language responses. A multiple language response is a combination of non-official language response with a response of English and/or French.
Education
Educational attainment Education Footnote 1
In 2011, 40.2% of the 15,285 adults aged 25 years and over in Nunavut had completed some form of postsecondary education, compared with 59.6% at the national level.
Of the population aged 25 years and over in Nunavut, 14.1% had a university certificate or degree. An additional 16.2% had a college diploma and 9.8% had a trades certificate.
The share of the adult population that had completed a high school diploma as their highest level of educational attainment was 11.7%, and 48.1% had completed neither high school nor any postsecondary certificates, diplomas or degrees.
Table 1 – Population aged 25 and over by highest level of educational attainmentEducation Footnote 1, Nunavut, Canada
Table summary
This table presents the population aged 25 years and over by highest level of educational attainment. The column headings are: highest level of educational attainment; Nunavut and Canada, which are divided in number and percentage. The rows are: total population aged 25 years and over; no certificate, diploma or degree; high school diploma; a subtotal for postsecondary certificate, diploma or degree: trades certificate which is a subtotal of the rows for trades certificate or diploma (other than apprenticeship) and registered apprenticeship certificate; college diploma; university certificate below bachelor; university degree which is a subtotal of the rows for bachelor's degree; university certificate above bachelor; degree in medicine, dentistry, veterinary medicine or optometry; master's degree; earned doctorate.
| Highest level of educational attainment | Nunavut | Canada | ||
|---|---|---|---|---|
| Number | % | Number | % | |
| Total – Population aged 25 years and over | 15,285 | 100.0 | 22,935,460 | 100.0 |
| No certificate, diploma or degree | 7,355 | 48.1 | 3,956,620 | 17.3 |
| High school diplomaEducation Footnote 2 | 1,795 | 11.7 | 5,300,080 | 23.1 |
| Postsecondary certificate, diploma or degree | 6,140 | 40.2 | 13,678,765 | 59.6 |
| Trades certificateEducation Footnote 3 | 1,500 | 9.8 | 2,744,380 | 12.0 |
| Trades certificate or diploma (other than apprenticeship) | 965 | 6.3 | 1,596,595 | 7.0 |
| Registered Apprenticeship certificateEducation Footnote 4 | 535 | 3.5 | 1,147,790 | 5.0 |
| College diplomaEducation Footnote 5 | 2,475 | 16.2 | 4,487,520 | 19.6 |
| University certificate below bachelorEducation Footnote 6 | 240 | 1.6 | 1,100,325 | 4.8 |
| University degreeEducation Footnote 7 | 1,920 | 12.6 | 5,346,530 | 23.3 |
| Bachelor's degree | 1,255 | 8.2 | 3,347,425 | 14.6 |
| University certificate above bachelorEducation Footnote 8 | 195 | 1.3 | 571,525 | 2.5 |
| Degree in medicine, dentistry, veterinary medicine or optometry | 15 | 0.1 | 151,715 | 0.7 |
| Master's degree | 430 | 2.8 | 1,068,190 | 4.7 |
| Earned doctorate | 30 | 0.2 | 207,680 | 0.9 |
Overall, successive generations of Canadians have been completing high school and attaining postsecondary qualifications in increasing proportions. In 2011, 41.7% of Canadians aged 65 years and over had a postsecondary credential; this compares with 69.5% among adults between the ages of 25 and 44. As well, 35.7% of those aged 65 years and over had not completed any certificate, diploma or degree compared with 9.5% of individuals aged 25 to 44.
In Nunavut, 19.8% of those aged 65 years and over had a postsecondary credential, compared to 39.2% of adults aged 25 to 44; 78.2% of individuals aged 65 years and over had no certificate, diploma or degree, compared to 47.0% of 25 to 44 year-olds.
Nunavut – Proportion of the population aged 25 years and over by level of educational attainment and age groups 
Figure description
This vertical bar graph shows the proportion of the population aged 25 years and over by level of educational attainment and age groups. The age groups are: 25 to 44, 45 to 64 and 65 and over. The y-axis is the percentage of the population and the x-axis is level of educational attainment including: No certificate, diploma or degree; High school diploma; Trades certificate; College diploma; University certificate below bachelor; Bachelor's degree; University above bachelor.

Major field of study
Table 2 – Most common fields of studyEducation Footnote 9 for the population aged 25 years and over with postsecondary qualifications by level of educational attainmentEducation Footnote 1, Nunavut, Canada
Table summary
This table presents the five most common fields of study by level of educational attainment for the population aged 25 years and over with postsecondary qualifications. The column headings are: field of study; Nunavut and Canada, which are divided in number, percentage and rank. The rows are: the five most common fields of study under the educational attainment levels of: trades certificate; college diploma; university.
| Field of study | Nunavut | Canada | ||||
|---|---|---|---|---|---|---|
| Number | % | Rank | Number | % | Rank | |
| Trades certificate | ||||||
| Construction trades | 465 | 31.0 | 1 | 434,090 | 15.8 | 2 |
| Transportation and materials moving | 305 | 20.3 | 2 | 123,565 | 4.5 | 8 |
| Mechanic and repair technologies/technicians | 185 | 12.3 | 3 | 485,755 | 17.7 | 1 |
| Personal and culinary services | 85 | 5.7 | 4 | 328,125 | 12.0 | 4 |
| Business, management, marketing and related support services | 80 | 5.3 | 5 | 329,330 | 12.0 | 3 |
| College diploma | ||||||
| Business, management, marketing and related support services | 735 | 29.7 | 1 | 1,242,870 | 27.7 | 1 |
| Health professions and related programs | 205 | 8.3 | 2 | 787,660 | 17.6 | 2 |
| Education | 145 | 5.9 | 3 | 137,815 | 3.1 | 8 |
| Construction trades | 135 | 5.5 | 4 | 120,245 | 2.7 | 10 |
| Engineering technologies and engineering-related fields | 130 | 5.3 | 5 | 413,205 | 9.2 | 3 |
| UniversityEducation Footnote 10 | ||||||
| Education | 595 | 27.5 | 1 | 921,390 | 14.3 | 2 |
| Business, management, marketing and related support services | 295 | 13.7 | 2 | 1,215,210 | 18.8 | 1 |
| Health professions and related programs | 235 | 10.9 | 3 | 702,280 | 10.9 | 3 |
| Social sciences | 165 | 7.6 | 4 | 429,185 | 6.7 | 5 |
| Engineering | 85 | 3.9 | 5 | 686,100 | 10.6 | 4 |
Location of studyEducation Footnote 11
In 2011, there were 6,140 residents of Nunavut aged 25 years and over with postsecondary credentials. Of these graduates, 37.1% had studied in Nunavut, 57.1% had studied in another province or territory and 5.9% had studied outside Canada. Nationally, 72.5% of graduates had studied in the same province/territory in which they lived in 2011, 10.4% had studied in another province or territory and 17.1% had studied outside Canada.
In all provinces, individuals with trades or college certificates were more likely than those with university credentials to have earned their highest certificate, diploma or degree in the province in which they lived in 2011.
Table 3 – Population aged 25 years and over with postsecondary qualifications by location of study and by level of educational attainment, Nunavut
Table summary
This table presents location of study compared with the province or territory of residence in 2011 for the population aged 25 years and over with postsecondary qualifications by level of educational attainment. The column headings are: educational attainment; location of study divided into studied in Nunavut, studied in another province / territory, studied outside Canada further divided in number and percentage. The rows are: total population aged 25 years and over with postsecondary qualifications; trades certificate; college diploma; university certificate below bachelor; bachelor's degree; university above bachelor.
| Educational attainment | Location of study | |||||
|---|---|---|---|---|---|---|
| Studied in Nunavut | Studied in another province/territory | Studied outside Canada | ||||
| number | % | number | % | number | % | |
| Total population aged 25 years and over with postsecondary qualifications | 2,280 | 37.1 | 3,505 | 57.1 | 360 | 5.9 |
| Trades certificate | 810 | 54.0 | 675 | 45.0 | 15 | 1.0 |
| College diploma | 1,300 | 52.5 | 1,130 | 45.7 | 45 | 1.8 |
| University certificate below bachelor | 55 | 22.9 | 160 | 66.7 | 15 | 6.3 |
| Bachelor's degree | 90 | 7.2 | 1,010 | 80.5 | 155 | 12.4 |
| University above bachelor | 25 | 3.7 | 525 | 78.4 | 125 | 18.7 |
Note(s):
- Footnote 1
-
The terms 'Educational attainment,' 'level of educational attainment' and 'highest level of educational attainment' used in this document refer to the Highest certificate, diploma or degree completed by a person. The portion of the population that completed each type of education noted is the portion that completed it as their highest certificate, diploma or degree.
- Footnote 2
-
'High school diploma' refers to 'secondary (high) school diploma or equivalent.'
- Footnote 3
-
'Trades certificate' refers to 'apprenticeship or trades certificate or diploma,' and is an aggregation which includes both 'Registered Apprenticeship certificate' as well as 'trades certificate or diploma (other than apprenticeship).'
- Footnote 4
-
'Registered Apprenticeship certificate' includes those with a certificate of qualification/journeyperson's designation.
- Footnote 5
-
'College diploma' refers to 'college, CEGEP or other non-university certificate or diploma.'
- Footnote 6
-
'University certificate below bachelor' refers to 'university certificate or diploma below bachelor level.' Comparisons with other data sources suggest that this category was over-reported in the NHS. It is recommended that users interpret the results for this category with caution. For further information, please refer to the Education Reference Guide, National Household Survey.
- Footnote 7
-
'University degree' refers to 'university certificate, diploma or degree at bachelor level or above.'
- Footnote 8
-
'University certificate above bachelor' refers to 'university certificate or diploma above bachelor level'.
- Footnote 9
-
'Field of study' in this table is classified based on the 2-digit series from the Classification of Instructional Programs (CIP) Canada 2011. It is the major field of study for the highest postsecondary certificate, diploma or degree completed by the person.
- Footnote 10
-
'University' in this table refers to 'university certificate, diploma or degree,' and includes all university certificates, diplomas and degrees including university certificates below the bachelor level, bachelor's degrees and university certificates and degrees above the bachelor level.
- Footnote 11
-
'Location of study' refers to the province, territory or country of the institution where the highest postsecondary certificate, diploma or degree was completed. Here, location of study is compared with province or territory of residence to indicate whether the location of study is the same province or territory as the person's residence in 2011, a different Canadian province or territory, or outside Canada.
Labour
Labour
In Nunavut, 11,070 people were employed and 2,415 were unemployed for a total labour force of 13,485 in May 2011. The employment rate was at 52.1% and the unemployment rate was at 17.9%.
Table 1 Total population aged 15 years and over by labour force status, Nunavut, Canada
Table summary
This table presents the labour force status for the population aged 15 years and over. The column headings are: labour force status; Nunavut and Canada. The rows are: total population aged 15 years and over with sub-totals of: in the labour force (number) and not in the labour force (number). In the labour force (number) there are two components: employed (number) and unemployed (number). Rates are also presented for: participation rate (%); employment rate (%); and unemployment rate (%).
| Labour force status | Nunavut | Canada |
|---|---|---|
Table note(s):
|
||
| Total population aged 15 years and overLabour Table 1 Footnote 1 | 21,255 | 27,259,525 |
| In the labour force | 13,485 | 17,990,080 |
| Employed | 11,070 | 16,595,035 |
| Unemployed | 2,415 | 1,395,050 |
| Not in the labour force | 7,770 | 9,269,445 |
| Participation rate | 63.4 | 66.0 |
| Employment rate | 52.1 | 60.9 |
| Unemployment rate | 17.9 | 7.8 |
Within Nunavut, 15.7% of the employed labour force was aged 15 to 24 and 12.0% was aged 55 to 64. This compares to 13.1% and 15.3% respectively for Canada.
Table 2 Employed labour force by age groups, Nunavut, Canada
Table summary
This table presents the employed labour force by selected age groups. The column headings are: age groups and Nunavut and Canada, which are divided in number and percentage. The rows are: total; age groups; 15 to 24 years; 25 to 34 years; 35 to 54 years; 55 to 64 years; 65 years and over.
| Age groups | Nunavut | Canada | ||
|---|---|---|---|---|
| number | % | number | % | |
| Total | 11,070 | 100.0 | 16,595,035 | 100.0 |
| 15 to 24 years | 1,740 | 15.7 | 2,180,880 | 13.1 |
| 25 to 34 years | 2,905 | 26.2 | 3,394,445 | 20.5 |
| 35 to 54 years | 4,835 | 43.7 | 7,912,010 | 47.7 |
| 55 to 64 years | 1,330 | 12.0 | 2,535,655 | 15.3 |
| 65 years and over | 250 | 2.3 | 572,045 | 3.4 |
Within Nunavut, the top occupations were: Janitors, caretakers and building superintendents; Cashiers; Elementary school and kindergarten teachers. For Canada as a whole the top occupations were: Retail salespersons; Retail and wholesale trade managers; Administrative assistants.
Table 3 Top occupations for the employed labour force, Nunavut, Canada
Table summary
This table presents the top occupations. The column headings are: occupation, Nunavut and Canada, which are divided in number and percentage. The rows are: the top occupations.
| Occupation | Nunavut | Canada | ||||
|---|---|---|---|---|---|---|
| number | % | Rank | number | % | Rank | |
| Janitors, caretakers and building superintendents | 550 | 5.0 | 1 | 195,540 | 1.2 | 13 |
| Cashiers | 445 | 4.0 | 2 | 308,950 | 1.9 | 5 |
| Elementary school and kindergarten teachers | 385 | 3.5 | 3 | 271,200 | 1.6 | 7 |
| Administrative officers | 255 | 2.3 | 4 | 246,875 | 1.5 | 9 |
| Transport truck drivers | 245 | 2.2 | 5 | 261,775 | 1.6 | 8 |
| Store shelf stockers, clerks and order fillers | 240 | 2.2 | 6 | 150,770 | 0.9 | 23 |
| Secondary school teachers | 235 | 2.1 | 7 | 173,975 | 1.0 | 19 |
| Light duty cleaners | 230 | 2.1 | 8 | 213,515 | 1.3 | 11 |
| General office support workers | 230 | 2.1 | 8 | 218,830 | 1.3 | 10 |
| Early childhood educators and assistants | 215 | 1.9 | 10 | 187,750 | 1.1 | 16 |
Within Nunavut, the top industries were: Provincial and territorial public administration; Elementary and secondary schools; Local, municipal and regional public administration. For Canada as a whole the top industries were: Elementary and secondary schools; Hospitals; Grocery stores.
Table 4 Top industries for the employed labour force, Nunavut, Canada
Table summary
This table presents the top industries. The column headings are: industry, Nunavut and Canada, which are divided in number and percentage. The rows are: the top industries.
| Industry | Nunavut | Canada | ||||
|---|---|---|---|---|---|---|
| number | % | Rank | number | % | Rank | |
| Provincial and territorial public administration | 2,085 | 18.8 | 1 | 317,545 | 1.9 | 10 |
| Elementary and secondary schools | 925 | 8.4 | 2 | 777,015 | 4.7 | 1 |
| Local, municipal and regional public administration | 915 | 8.3 | 3 | 372,630 | 2.2 | 5 |
| Grocery stores | 805 | 7.3 | 4 | 405,685 | 2.4 | 3 |
| Other federal services | 500 | 4.5 | 5 | 371,190 | 2.2 | 6 |
| Aboriginal public administration | 345 | 3.1 | 6 | 33,360 | 0.2 | 125 |
| Traveller accommodations | 325 | 2.9 | 7 | 153,340 | 0.9 | 26 |
| Lessors of real estate | 320 | 2.9 | 8 | 86,100 | 0.5 | 51 |
| Scheduled air transportation | 280 | 2.5 | 9 | 50,430 | 0.3 | 85 |
| Child day-care services | 245 | 2.2 | 10 | 202,850 | 1.2 | 18 |
The number of self-employed in Nunavut amounted to 385 or 3.5% of all total employed workers.
Table 5 Employed labour force by class of workers, Nunavut, Canada
Table summary
This table presents class of worker. The column headings are: class of worker; Nunavut and Canada, which are divided in number and percentage. The rows are: total employed labour force; with subtotals of employee (number and percent) and total – self-employed (number and percent). The total – self-employed there are two components: self-employed (incorporated or unincorporated) and unpaid family worker.
| Class of worker | Nunavut | Canada | ||
|---|---|---|---|---|
| number | % | number | % | |
Table note(s):
|
||||
| Total employed labour force | 11,070 | 100.0 | 16,595,035 | 100.0 |
| Employee | 10,685 | 96.5 | 14,720,340 | 88.7 |
| Total – Self-employedTable 5 Footnote 1 | 385 | 3.5 | 1,874,695 | 11.3 |
| Self-employed (incorporated or unincorporated) | 380 | 3.4 | 1,829,120 | 11.0 |
| Unpaid family worker | 0 | 0.0 | 45,575 | 0.3 |
In 2011, 1.1% of commuters within the province used public transit to get to work. This compares to a national level of 12.0%. 26.4% of the population used a car, truck or van as a driver, while 16.1% used a car, truck or van as a passenger. The average commuting time to work in the province was 9.7 minutes, this compares to a national commuting time of 25.4 minutes.
Within Nunavut, 85.9% of the employed labour force aged 15 years and over worked at their usual place, 2.5% worked at home and 11.6% had no fixed workplace address.
Table 6 Employed labour force by mode of transportation, Nunavut, Canada
Table summary
This table presents the employed labour force by mode of transportation. The column headings are: mode of transportation; Nunavut and Canada, which are divided in number and percentage. The rows are: total employed labour force with a usual place of work or no fixed workplace address; car, truck or van as driver; car, truck or van as passenger; public transit; walked; bicycle; other.
| Mode of transportation | Nunavut | Canada | ||
|---|---|---|---|---|
| number | % | number | % | |
| Total employed labour force with a usual place of work or no fixed workplace address | 10,795 | 100.0 | 15,385,940 | 100.0 |
| Car, truck or van as driver | 2,850 | 26.4 | 11,393,140 | 74.0 |
| Car, truck or van as passenger | 1,735 | 16.1 | 867,050 | 5.6 |
| Public transit | 120 | 1.1 | 1,851,520 | 12.0 |
| Walked | 5,095 | 47.2 | 880,815 | 5.7 |
| Bicycle | 10 | 0.1 | 201,785 | 1.3 |
| Other | 985 | 9.1 | 191,625 | 1.2 |
Table 7 Average commuting duration for the employed labour force, Nunavut, Canada
Table summary
This table presents the average commuting duration. The column headings are: average commuting duration; Nunavut and Canada. The row includes the average commuting duration.
| Commuting duration | Nunavut | Canada |
|---|---|---|
| Average | 9.7 | 25.4 |
Table 8 Employed Labour force by time leaving for work, Nunavut, Canada
Table summary
This table presents time leaving for work. The column headings are: time leaving for work; Nunavut and Canada, which are divided in number and percentage. The rows are: total; 5 to 5:59 a.m.; 6 to 6:59 a.m.; 7 to 7:59 a.m.; 8 to 8:59 a.m.; 9 to 11:59 a.m.; 12 p.m. to 4:59 a.m.
| Time leaving for work | Nunavut | Canada | ||
|---|---|---|---|---|
| number | % | number | % | |
| Total | 10,795 | 100.0 | 15,385,940 | 100.0 |
| 5 to 5:59 a.m. | 115 | 1.1 | 980,550 | 6.4 |
| 6 to 6:59 a.m. | 420 | 3.9 | 2,782,690 | 18.1 |
| 7 to 7:59 a.m. | 1,905 | 17.6 | 4,472,745 | 29.1 |
| 8 to 8:59 a.m. | 5,645 | 52.3 | 3,397,085 | 22.1 |
| 9 to 11:59 a.m. | 1,425 | 13.2 | 1,593,230 | 10.4 |
| 12 p.m. to 4:59 a.m. | 1,290 | 11.9 | 2,159,630 | 14.0 |
Table 9 Employed labour force by place of work status, Nunavut, Canada
Table summary
This table presents place of work. The column headings are: place of work; Nunavut and Canada, which are divided in number and percentage. The rows are: total; usual place of work; worked at home; worked outside Canada; no fixed workplace address.
| Place of work | Nunavut | Canada | ||
|---|---|---|---|---|
| number | % | number | % | |
| Total employed labour force | 11,070 | 100.0 | 16,595,035 | 100.0 |
| Usual place of work | 9,505 | 85.9 | 13,517,690 | 81.5 |
| Worked at home | 275 | 2.5 | 1,142,640 | 6.9 |
| Worked outside Canada | 0 | 0.0 | 66,455 | 0.4 |
| No fixed workplace address | 1,285 | 11.6 | 1,868,245 | 11.3 |
In Nunavut, 72.3% (10,690) of the population aged 15 years and over who worked in 2010 or 2011 reported English only as the language used most often at work, 0.4% (60) reported French only and 0.0% (0) said they used both official languages (English and French) equally. In addition, 0.8% of the population aged 15 years and over who worked in 2010 or 2011 reported using an official language and a non-official language equally most often at work and 26.5% a non-official language only.
Furthermore, 20.3% (2,995) of the population aged 15 years and over who worked in 2010 or 2011 reported working in English on a regular basis, 1.8% (260) in French on a regular basis and 0.0% (0) in the country's two official languages on a regular basis. In addition, 0.2% (35) of of the population aged 15 years and over who worked in 2010 or 2011 reported using an official language and a non-official language on a regular basis at work and 30.7% (4,535) a non-official language only.
In Canada, 76.4% (14,622,905) of the population aged 15 years and over who worked in 2010 or 2011 reported English only as the language used most often at work, 20.0% (3,831,535) reported French only and 1.7 (317,135) said they used both official languages (English and French) equally. Furthermore, 0.6% of the population aged 15 years and over who worked in 2010 or 2011 reported using an official language and a non-official language equally most often at work.
As for the language used at work on a regular basis in Canada, the proportions are as follows: 6.0% (1,148,980) reported using English; 3.4% (645,075) use French; 0.0% (1,925) use both official languages; 0.2% (34,290) reported using an official language and a non-official language; and 2.2% (411,735) a non-official language only.
Table 10 Languages used at work, Nunavut, Canada
Table summary
This table presents the languages used most often and regularly at work. The column headings are: languages used at work; language used most often at work and language used regularly at work for Nunavut and Canada, which are divided in number and percentage. The rows are: Total population 15 years and over who worked since 2010; English only; French only; other language only; English and French; English and other language; French and other language; English, French and other language.
| Languages used at work | Language used most often | Language used regularlyTable 1 Footnote 1 | ||||||
|---|---|---|---|---|---|---|---|---|
| Nunavut | Canada | Nunavut | Canada | |||||
| number | % | number | % | number | % | number | % | |
Table note(s):
|
||||||||
| Total population aged 15 years and over who worked since 2010 | 14,780 | 100.0 | 19,133,310 | 100.0 | 7,825 | 52.9 | 2,242,010 | 11.7 |
| English only | 10,690 | 72.3 | 14,622,905 | 76.4 | 2,995 | 20.3 | 1,148,980 | 6.0 |
| French only | 60 | 0.4 | 3,831,535 | 20.0 | 260 | 1.8 | 645,075 | 3.4 |
| Other language only | 3,915 | 26.5 | 251,020 | 1.3 | 4,535 | 30.7 | 411,735 | 2.2 |
| English and French | 0 | 0.0 | 317,135 | 1.7 | 0 | 0.0 | 1,925 | 0.0 |
| English and other language | 115 | 0.8 | 94,100 | 0.5 | 0 | 0.0 | 15,125 | 0.1 |
| French and other language | 0 | 0.0 | 5,180 | 0.0 | 30 | 0.2 | 19,020 | 0.1 |
| English, French and other language. | 0 | 0.0 | 11,445 | 0.1 | 0 | 0.0 | 140 | 0.0 |
| None | ... | ... | ... | ... | 6,950 | 47.0 | 16,891,300 | 88.3 |
In Nunavut, the non-official languages most used, most often or regularly, with or without an official language, are Inuktitut, Inuinnaqtun, Inuit languages, n.i.e. and Innu/Montagnais, which account respectively for 28.3% (8,370), 0.5% (155), 0.1% (20) and 0.1% (20) of the population aged 15 years and over who worked in 2010 or 2011.
In Canada, the non-official languages most used, most often or regularly, with or without an official language, are Chinese languages, Spanish and Panjabi (Punjabi), which account respectively for 1.2% (224,195), 0.4% (82,050) and 0.4% (71,430) of the population aged 15 years and older who worked in 2010 or 2011.
Table 11 Non-official languages used at work, Nunavut, Canada
Table summary
This table presents non-official languages used at work. The column headings are: languages used at work; language used at least regularly at work, language used most often at work and language used regularly at work for Nunavut and Canada, which are divided in number and percentage. The rows are the top non-official languages used at least regularly at work.
| Languages used at work | Language used at least regularlyTable 2 Footnote 2 | Language used most oftenTable 2 Footnote 2 | Language used regularlyTable 2 Footnote 1,Table 2 Footnote 3 | |||||||||||||||
|---|---|---|---|---|---|---|---|---|---|---|---|---|---|---|---|---|---|---|
| Nunavut | Canada | Nunavut | Canada | Nunavut | Canada | |||||||||||||
| number | % | rank | number | % | rank | number | % | rank | number | % | rank | number | % | rank | number | % | rank | |
Table note(s):
|
||||||||||||||||||
| Inuktitut | 8,370 | 28.3 | 1 | 13,620 | 0.1 | 15 | 3,975 | 26.9 | 1 | 7,575 | 0.0 | 12 | 4,395 | 56.2 | 1 | 6,045 | 0.3 | 16 |
| Inuinnaqtun | 155 | 0.5 | 2 | 185 | 0.0 | 92 | 15 | 0.1 | 2 | 15 | 0.0 | 123 | 140 | 1.8 | 2 | 170 | 0.0 | 79 |
| Inuit languages, n.i.e. | 20 | 0.1 | 3 | 85 | 0.0 | 114 | 15 | 0.1 | 2 | 45 | 0.0 | 95 | 10 | 0.1 | ... | 40 | 0.0 | 129 |
| Innu/Montagnais | 20 | 0.1 | 3 | 3,840 | 0.0 | 27 | 15 | 0.1 | 2 | 2,540 | 0.0 | 21 | 10 | 0.1 | ... | 1,305 | 0.1 | 36 |
Income
Income composition
The total income for the population in private households can be broken down into two basic components: market incomeIncome Footnote 1 and government transfers.Income Footnote 2 In Nunavut, 87.1% of total income was from market income in 2010 and 12.9% was from government transfers. (Aggregate total income for Nunavut was 858.7 million dollars in 2010.)
Figure 1 Income composition for the population in private households in 2010
Figure description
This stacked horizontal bar figure shows income composition for the population in private households. The y-axis is Canada and the provinces and territories. The x-axis is percentage of income composition (market income and government transfer payments).

Market income's main component was employment income. In Nunavut, it accounted for $96.70 of every $100 of market income, above the figure for Canada of $85.20. For the two components of employment income, wages and salaries represented $94.90 and net income from self-employment, $1.90.
The other components of market income were smaller than employment income: in Nunavut, investment income represented $0.80 per $100 of market income, retirement income, $1.30 and $1.10 came from other private sources of money.
The main government transfer received in Nunavut was Other income from government sources with $41.60 of every $100 of total government transfers received, followed by: Child benefits ($27.50), Employment Insurance benefits ($15.70), Old Age Security (OAS) pension and Guaranteed Income Supplement ($8.00), and Canada Pension Plan or Quebec Pension Plan ($7.30).
Table 1 – Income composition for the population in private households in 2010, Nunavut, Canada
Table summary
This table shows income composition for the population in private households in 2010. The column headings are: income composition, Nunavut and Canada. The rows are: aggregate total income in millions of dollars which has main components of market income and government transfer payments. Market income is further divided into: employment income in percentage (including wages and salaries in percentage and self-employment income in percentage); investment income in percentage; retirement pensions, superannuation and annuities in percentage; other money income. Government transfer payments is further divided into: Canada / Quebec pension plan benefits in percentage; Old Age Security pension and Guaranteed Income Supplement in percentage; employment insurance benefits in percentage; child benefits in percentage and other income from government sources in percentage. Also included are income taxes paid (as a percent of total income) and after-tax income (as a percent of total income).
| Income composition | Nunavut | Canada |
|---|---|---|
| Aggregate total income (million $) | 858.7 | 1,053,582.1 |
| Composition of total income in 2010 (%) | 100.0 | 100.0 |
| Market income (%) | 87.1 | 87.6 |
| Employment income (%) | 84.3 | 74.7 |
| Wages and salaries (%) | 82.6 | 70.3 |
| Self-employment income (%) | 1.6 | 4.4 |
| Investment income (%) | 0.7 | 4.6 |
| Retirement pensions, superannuation and annuities (%) | 1.2 | 6.7 |
| Other money income (%) | 1.0 | 1.7 |
| Government transfer payments (%) | 12.9 | 12.4 |
| Canada/Quebec Pension Plan benefits (%) | 0.9 | 3.5 |
| Old Age Security pension and Guaranteed Income Supplement (%) | 1.0 | 3.1 |
| Employment Insurance benefits (%) | 2.0 | 1.8 |
| Child benefits (%) | 3.5 | 1.5 |
| Other income from government sources (%) | 5.4 | 2.6 |
| Income taxes paid – as a % of total income | 14.0 | 16.4 |
| After-tax income – as a % of total income | 86.0 | 83.6 |
High total income
Among the Canadian population in private households aged 15 years and over, ten percent had total incomes of more than $80,400 in 2010. To be in the top five percent, Canadians needed to have a total income of slightly above $102,300 and to be in the top one percent required just over $191,100, nearly seven times the national median income of $27,800.Income Footnote 3
In Nunavut, 11.1% percent of the population aged 15 years and over had total income that put them in the top five percent and 0.6% in the top one percent. This compared with 5.0% and 1.0% in Canada.
Table 2 – Population aged 15 years and over by total income, Nunavut, Canada
Table summary
The following table presents the population aged 15 years and over by total income. The column headings are: total income, Nunavut and Canada. The rows are: population aged 15 years and over by total income (count); without income or less than $27,815 in percentage; without income or less than $12,025 in percentage; $12,025 to $27,814 in percentage; $27,815 and over in percentage; $27,815 to $51,304 in percentage; $51,305 and over in percentage; $80,420 and over (top 10 percent) in percentage; $102,305 and over top 5 percent) in percentage and $191,150 and over (top 1 percent) in percentage.
| Total income | Nunavut | Canada |
|---|---|---|
| Population 15 years and over by total income (count) | 21,255 | 27,259,525 |
| Without income or less than $27,815 (%) | 55.5 | 50.0 |
| Without income or less than $12,025 (%) | 34.5 | 25.0 |
| $12,025 to $27,814 (%) | 21.0 | 25.0 |
| $27,815 and over (%) | 44.5 | 50.0 |
| $27,815 to $51,304 (%) | 15.0 | 25.0 |
| $51,305 and over (%) | 29.5 | 25.0 |
| $80,420 and over (top 10 percent) (%) | 19.2 | 10.0 |
| $102,305 and over (top 5 percent) (%) | 11.1 | 5.0 |
| $191,150 and over (top 1 percent) (%) | 0.6 | 1.0 |
A national map showing the spatial distribution of persons with total income in the top five percent of persons with the highest total income is also available. Canada. Percentage of population in top five percent of total income in 2010 by 2011 census division (CD)
Employment income
Of those persons with employment income in Nunavut, 44.8% worked full year, full timeIncome Footnote 4 in 2010 compared to 50.3% in Canada. The median employment income was $77,130 for these workers ($47,868 for those in Canada).
The top two most common occupations for those working full-year full-time in 2010 in Nunavut were Janitors, caretakers and building superintendents; Elementary school and kindergarten teachers.
Table 3 – Median earnings of the most common full-year, full-time occupations in 2010, Nunavut, Canada
Table summary
The following table presents the most common occupations for full-year, full-time workers in 2010. The column headings are: population with earnings who worked full-year, full-time in 2010, Nunavut divided into number and median earnings in dollars and Canada divided in median earnings in dollars. The rows are the most common occupations.
| Population with earnings who worked full-year, full-time in 2010Income Footnote 5 | Nunavut | Canada | |
|---|---|---|---|
| number | median earnings ($) | median earnings ($) | |
| Janitors, caretakers and building superintendents | 310 | 60,133 | 36,647 |
| Elementary school and kindergarten teachers | 270 | 93,643 | 67,530 |
Family income
The median after-tax income of economic families in Nunavut in 2010 was $76,618, the median for couple families was $89,306 and for lone-parent families, $45,411. For persons not in economic families (persons living alone or with non relatives only), the median after-tax income was $45,761.
These compare to the medians in Canada of $67,044 for after-tax family income of all economic families, $72,356 for couple families, $42,401 for lone-parent families and $25,761 for persons living alone or without relatives.
Table 4 – Median after-tax income in 2010 for economic families and persons not in economic families, Nunavut, Canada
Table summary
This table shows median after-tax income in 2010 by economic family structure and sex. The column headings are: economic family structure and sex, Nunavut divided into number and median after-tax income in dollars and Canada divided into median after-tax income in dollars. The rows are: all economic families (couple families, lone-parent families, other economic families); persons not in economic families (males, females).
| Economic family structure and sex | Nunavut | Canada | |
|---|---|---|---|
| number | median after-tax income ($) | median after-tax income ($) | |
| All economic families | 6,925 | 76,618 | 67,044 |
| Couple families | 5,140 | 89,306 | 72,356 |
| Lone-parent families | 1,445 | 45,411 | 42,401 |
| Other economic families | 345 | 56,898 | 55,484 |
| Persons not in economic families | 2,165 | 45,761 | 25,761 |
| Males | 1,295 | 40,543 | 28,197 |
| Females | 875 | 56,555 | 23,917 |
Figure 2 Median after-tax income in 2010 for Nunavut and Canada
Figure description
The following vertical bar figure shows the median after-tax income in 2010 by economic family structure and sex. The y-axis is the median after-tax income in dollars. The x-axis is economic family structure and sex including: all economic families; couple families; lone-parent families; other economic families; persons not in economic families; males not in economic families and females not in economic families.

Families came in different sizes and larger families may have benefited from pooling of resources and economies of scale. In Nunavut, based on their after-tax income adjusted for family size, 45.2% of the population was in the top half of the income distribution, below the rate of 50.0% in Canada.
In Nunavut, the percentage of the population in the lowest income decile groupIncome Footnote 6 at 12.9% was higher than in Canada (10.0%). The percentage of the population in the highest decile group was 15.6%, higher than in Canada (10.0%).
Table 5 – Population in private households by adjusted after-tax family income in 2010, Nunavut, Canada
Table summary
The following table shows the population in private households by adjusted after-tax income in 2010. The column headings are: percentage of private households in decile groups of adjusted after-tax income in 2010, Nunavut and Canada. The rows are: population in private households as count, decile groups.
| Population in private households by decile groups of adjusted after-tax income in 2010 | Nunavut | Canada |
|---|---|---|
| Population in private households (count) | 31,700 | 32,852,320 |
| In bottom half of Canadian distribution (%) | 54.8 | 50.0 |
| In lowest decile (%) | 12.9 | 10.0 |
| In second decile (%) | 13.6 | 10.0 |
| In third decile (%) | 11.7 | 10.0 |
| In fourth decile (%) | 8.7 | 10.0 |
| In fifth decile (%) | 8.0 | 10.0 |
| In top half of Canadian distribution (%) | 45.2 | 50.0 |
| In sixth decile (%) | 7.3 | 10.0 |
| In seventh decile (%) | 6.7 | 10.0 |
| In eighth decile (%) | 7.5 | 10.0 |
| In ninth decile (%) | 8.0 | 10.0 |
| In highest decile (%) | 15.6 | 10.0 |
Note(s):
- Footnote 1
-
Market income includes income from all non-government sources such as employment, investments, private pensions and spousal or child support payments.
- Footnote 2
-
Government transfers include Canada/Quebec Pension Plan benefits, Old Age Security (OAS) pension and the Guaranteed Income Supplement, Employment Insurance benefits, child benefits and other income from government sources.
- Footnote 3
-
The population aged 15 years and over without income and those with negative income are included at the bottom of the distribution.
- Footnote 4
-
Full-year, full-time: worked 49 to 52 weeks, mainly full-time.
- Footnote 5
-
Only the most common occupations with at least 250 persons with earnings who worked full-year, full-time are presented here.
- Footnote 6
-
The income decile group provides a rough ranking of the economic situation of a person based on his or her relative position in the economic families adjusted after-tax income distribution. The population in private households is sorted according to its adjusted after-tax family income and then divided into 10 equal groups each containing 10% of the population.
Housing
Housing
The number of households in Nunavut was 8,660. The homeownership rate in Nunavut was 21.0%, which was lower than the national homeownership rate of 69.0%.
Canada, provinces and territories – Homeownership rate in 2011
Figure description
The following vertical bar chart shows the homeownership rates in percentage for Canada and the provinces and territories. The y-axis is the percentage in homeownership and the x-axis is the provinces and territories from east to west. The homeownership rate for Canada is represented as a horizontal line.
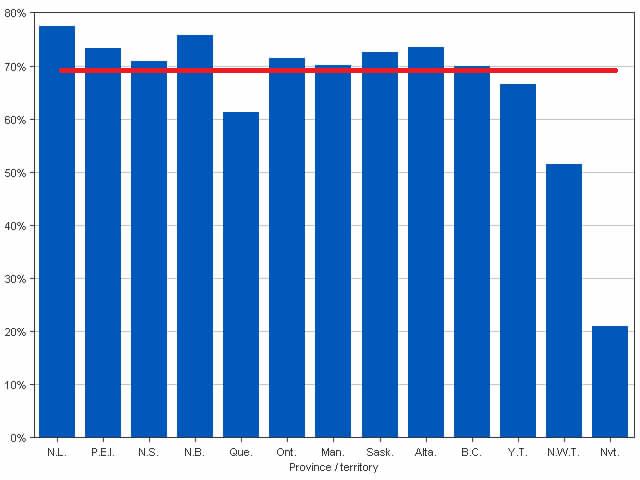
Table 1 – Housing tenure for all households, Canada, provinces and territories
Table summary
This table shows the number of households by housing tenure for Canada and the provinces and territories. The column headings are: geographic name; housing tenure including total households; owner; renter and band housing. The rows are: Canada and the provinces and territories from east to west.
| Geographic name | Housing tenure | |||
|---|---|---|---|---|
| Total households | Owner | Renter | Band housingHousing Table 1 Footnote 1 | |
| number | ||||
Table note(s):
|
||||
| Canada | 13,319,250 | 9,185,845 | 4,078,230 | 55,175 |
| Newfoundland and Labrador | 208,840 | 161,865 | 46,545 | 435 |
| Prince Edward Island | 56,455 | 41,455 | 14,910 | 90 |
| Nova Scotia | 390,280 | 276,200 | 111,870 | 2,215 |
| New Brunswick | 314,030 | 237,570 | 74,670 | 1,795 |
| Quebec | 3,395,220 | 2,077,640 | 1,311,200 | 6,380 |
| Ontario | 4,886,655 | 3,491,320 | 1,389,915 | 5,420 |
| Manitoba | 465,805 | 326,435 | 127,220 | 12,155 |
| Saskatchewan | 409,570 | 297,235 | 101,000 | 11,345 |
| Alberta | 1,390,285 | 1,022,645 | 357,950 | 9,690 |
| British Columbia | 1,764,630 | 1,234,715 | 524,995 | 4,925 |
| Yukon | 14,115 | 9,385 | 4,140 | 590 |
| Northwest Territories | 14,700 | 7,570 | 6,980 | 150 |
| Nunavut | 8,660 | 1,820 | 6,840 | 0 |
Nunavut – AffordabilityHousing Footnote 1
Households in Nunavut that paid 30% or more of household total income toward shelter costs represented 6.3% of non-farm, non-reserve households with total income greater than zero. This proportion was lower than the national proportion (25.2%).
A higher proportion of owner households paid 30% or more compared to tenant households in Nunavut (8.5% for owners versus 5.8% for renters).
Households in Nunavut paid an average monthly shelter cost of $836 – which was lower than the national amount of $1,050. The average monthly shelter cost for tenant households was $654. This was lower than the average monthly shelter cost for owner households of $1,522.
Table 2 – Housing affordability for non-farm, non-reserve households, Nunavut, Canada
Table summary
This table shows the percentage of households spending 30% or more of 2010 total income on shelter costs for the selected geography. The column headings are: housing indicator; housing tenure; Nunavut and Canada. The rows are: percentage of households spending 30% or more of 2010 total income on shelter costs and average monthly shelter cost ($). Both are further divided into total, owner and renter.
| Housing indicator | Housing tenure | Nunavut | Canada |
|---|---|---|---|
| Percentage of households spending 30% or more of 2010 total income on shelter costsHousing Table 2 Footnote 1 |
Total | 6.3 | 25.2 |
| Owner | 8.5 | 18.5 | |
| Renter | 5.8 | 40.1 | |
| Average monthly shelter cost ($) | Total | 836 | 1,050 |
| Owner | 1,522 | 1,141 | |
| Renter | 654 | 848 | |
Table note(s):
|
|||
Nunavut – Need for major repairsHousing Footnote 2,Housing Footnote 3
In Nunavut, 27.7% of households reported living in dwellings that required major repairs. This was higher than the national proportion of 7.4%. The proportion of households reporting major repairs requirements was lower for owners than renters (26.4% for owner-occupied dwellings and 28.0% for renter-occupied dwellings).
Table 3 – Need for major repairs by housing tenure, Nunavut, Canada
Table summary
This table shows percentage of households who reported that their dwelling was in need of major repairs. The column headings are: housing indicator; housing tenure; Nunavut and Canada. The row under housing indicator is: percentage of households reporting that their dwelling was in need of major repairs, which is further divided into total, owner, renter and band housing.
| Housing indicator | Housing tenure | Nunavut | Canada |
|---|---|---|---|
| Percentage of households reporting that their dwelling was in need of major repairs |
Total | 27.7 | 7.4 |
| Owner | 26.4 | 6.4 | |
| Renter | 28.0 | 9.1 | |
| Band housing | ... | 43.5 |
Nunavut – Suitability
In Nunavut, 30.5% of households in Nunavut lived in dwellings that were not suitable; that is, the dwelling was crowded because there were not enough bedrooms based on the National Occupancy Standard.Housing Footnote 4 This was higher than the national proportion of 6.0%. The proportion of households in dwellings that were not suitable was lower for owners than renters (19.8% owner households and 33.3% for renter households).
Table 4 – Housing suitability by housing tenure, Nunavut, Canada
Table summary
This table shows percentage of households living in dwellings that were not suitable. The column headings are: housing indicator; housing tenure; Nunavut and Canada. The rows are: percentage of households living in dwellings that were not suitable, which is further divided into total, owner, renter and band housing.
| Housing indicator | Housing tenure | Nunavut | Canada |
|---|---|---|---|
| Percentage of households living in dwellings that were not suitable |
Total | 30.5 | 6.0 |
| Owner | 19.8 | 3.8 | |
| Renter | 33.3 | 10.6 | |
| Band housing | ... | 25.2 |
Note(s):
- Footnote 1
-
In 1986, the Canada Mortgage and Housing Corporation (CMHC) and the provinces agreed to use the 30% threshold to measure affordability for the purposes of defining need for social housing. This agreement was reached during the development of the federal/provincial social housing programs.
- Footnote 2
-
The need for major repairs is based on the judgment of the respondent. Examples of major repairs provided to respondents included defective plumbing or electrical wiring, structural repairs to walls, floors or ceilings, etc.
- Footnote 3
-
The 2011 National Household Survey (NHS) estimate for the percentage of dwellings requiring major repair in Nunavut was higher than the comparable rate in the 2009/2010 Nunavut Housing Needs Survey. For other provinces and territories and for Canada, the percentage of dwellings requiring major repairs in the NHS was not statistically different when compared to other surveys. For more information, please consult the Housing Reference Guide, National Household Survey, Catalogue no. 99-014-X2011007.
- Footnote 4
-
Housing suitability and the National Occupancy Standard (NOS) were developed by Canada Mortgage and Housing Corporation (CMHC) through consultations with provincial housing agencies.
Related data
Related data
Map – Nunavut

- Date modified: