
Data visualization, 2016 Census
The 2016 Census of Population collects data for the total population of Canada. As the amount of data gathered increases, data visualizations have been introduced to help people, business owners, academics, and management at all levels, understand key information derived from the data. Data visualizations can be used to quickly communicate a message, to simplify the presentation of large amounts of data, to see data patterns and relationships, and to monitor changes in variables over time. 2016 Census data visualizations are available in the following formats:


Interactive charts


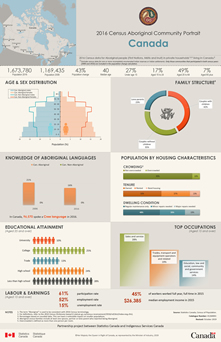
Infographics


Videos


- Date modified: