
2026 Census of Population Content Consultation Results: What we heard from Canadians
Text begins
Introduction
Data from the Census of Population are important for all communities and are vital for planning services that support employment, education and health care. Governments, businesses, associations, organizations and many others use these data to make important decisions. The census provides information that reflects Canada’s changing society and is a rich source of sociodemographic data for specific population groups such as one-parent families, Indigenous Peoples, immigrants, seniors and language groups.
Adjusted population counts from the census are then used as the base for the Population Estimates Program. Population estimates are used to determine representation in Parliament, calculate transfer payments between levels of government and support various government programs across the country.
Consulting with census data users and the Canadian public allows Statistics Canada to identify whether the questions asked in the census are relevant, how census data are used and how important the census is to Canadians. A formal consultation is set at the start of each census cycle. During that time, Statistics Canada invites data users, stakeholders and the general public to provide feedback on what information they use, for what purpose and what, if any, data gaps Statistics Canada should consider addressing in the next census cycle.
Evaluating and revising census questionnaire content ensures that it continues to be relevant. The following factors are considered when evaluating the census questionnaire content:
- legislative requirements
- program and policy needs
- burden on Canadians when answering questions
- privacy concerns
- input from consultation and testing
- data quality
- cost and operational considerations
- historical comparability
- availability of alternative data sources.
Statistics Canada conducted its content consultation process for the 2026 Census from fall 2022 to spring 2023 using an online questionnaire and one-on-one discussions with key stakeholders. All Canadians were welcome to participate in the online consultation. More than 2,900 respondents participated, an increased number from the last consultation cycle, demonstrating a high level of interest in helping to shape an important source of demographic and social information for decision making and analysis. Detailed responses were received from organizations and individuals representing federal, provincial, territorial and local government departments; First Nations people, Métis and Inuit; the general public; academia; special interest groups; and the private sector.
The country relies on high-quality information from the census. Statistics Canada uses the best standards and scientific methodology to design content for the Census of Population questionnaire. The longstanding and well-established process to determine census content has been in place for many censuses. It begins with broad consultation with data users, followed by qualitative tests and, finally, a quantitative content test.
Based on the findings from consultation and testing, Statistics Canada modifies the questions asked in the census. In 2023, various versions were tested qualitatively through cognitive and one-on-one interviews. These interviews were conducted across Canada in both official languages. Based on the results of qualitative testing, the census questionnaires were further revised and will be tested quantitatively and operationally among 198,000 households during the 2024 Census Test. After statistically analyzing the results of the 2024 Census Test and considering costs, operational factors and safeguards against quality loss, Statistics Canada will make recommendations to Cabinet, which will determine the final content of the 2026 Census questionnaire. The final content is then published in the Canada Gazette.
Content consultation process: Overview
This report focuses on the feedback Statistics Canada received during the 2026 Census of Population content consultation process through online consultation and stakeholder discussions. Content consultation focused primarily on assessing the information needs of census data users, as defined by the census evaluation criteria for user requirements (see Appendix A).
- Chapter 1 explains whom we consulted.
- Chapter 2 describes the strength of census data users’ needs such as the size of the population of interest. It also considers the respondents’ views on comparability, continuity over time and the relevance of census data; multivariate analysis; and the reported purposes for using census data, including legislative requirements and policy and program needs.
- Chapter 3 provides an assessment of the perceived data gaps in census content and the availability and suitability of alternative data sources.
- Chapter 4 focuses on information needs by census topic and how preparations for the 2024 Census Test will help meet these needs.
Chapter 1 – Whom we heard from
1.1 Online consultation
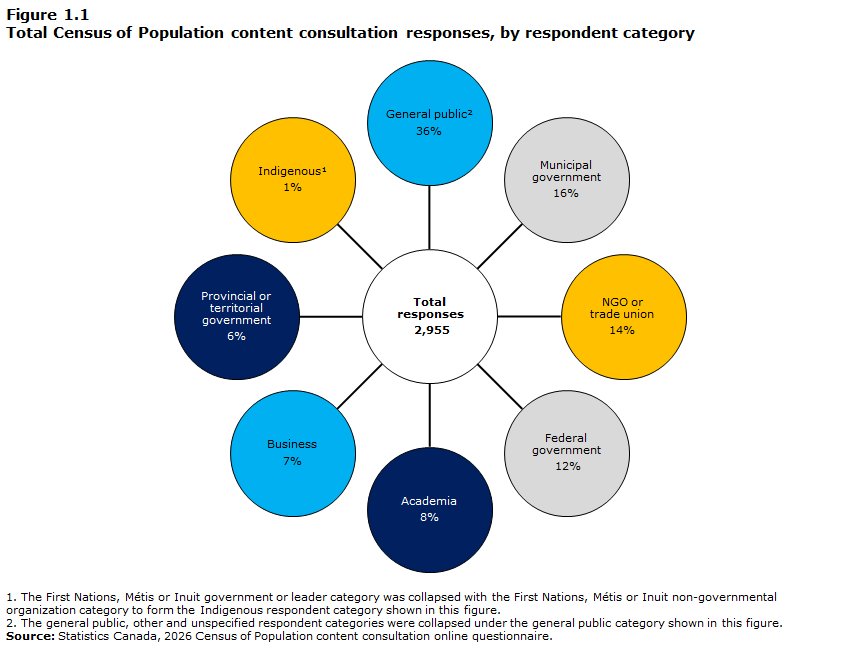
The Census of Population content consultation online questionnaire was launched on Monday, January 9, 2023, and closed on Friday, March 31, 2023. A total of 2,955 responses were gathered from individuals through the online questionnaire over the three-month period.
Email invitations were sent to over 6,000 known census data users, inviting them to participate and encouraging them to share the invitation with their networks of interested users. Anyone interested in sharing their views on the census content was welcome to participate in the online consultation through the Statistics Canada website; no access codes or passwords were required.
Data table for Figure 1.1
| Respondent category | Total responses | |
|---|---|---|
| number | percent | |
| Federal government | 351 | 12 |
| Provincial or territorial government | 192 | 6 |
| Municipal government | 472 | 16 |
| IndigenousData table for figure 1.1 Note 1 | 27 | 1 |
| Non-governmental organization or trade union | 402 | 14 |
| Academia | 247 | 8 |
| Business | 198 | 7 |
| General publicData table for figure 1.1 Note 2 | 1,066 | 36 |
| Total | 2,955 | 100 |
|
||
Statistics Canada heard from individuals and organizations in many sectors of Canadian society. Respondents to the online consultation questionnaire represented every province and territory and many sectors and categories of data users (see Figure 1.1). Across all categories, most respondents were census data users, with the exception of those in the general public category, where more than half indicated they do not currently use census data (see Appendix B).
Responses were received from 70 different federal organizations. Respondents from provincial or territorial governments, municipal governments, and non-governmental organizations (NGOs) or trade unions had the best representation across all provinces and territories (see Appendix B).
1.2 Stakeholder discussions
In addition to the online consultation, Statistics Canada met virtually with respondents from 19 federal departments and other interested organizations for discussions. At these meetings, stakeholders could ask about the online consultation, provide detailed descriptions of their data needs and ensure their needs were well understood. Invitations were sent from the Office of the Chief Statistician to deputy minister counterparts, requesting the participation of targeted stakeholders in the content consultation process. These discussions were summarized and included in this report. The following federal departments and agencies took part in these meetings:
- Canada Mortgage and Housing Corporation
- Federal Housing Advocate (Canadian Human Rights Commission)
- Crown-Indigenous Relations and Northern Affairs Canada
- Employment and Social Development Canada
- Health Canada
- Canadian Heritage
- Immigration, Refugees and Citizenship Canada (IRCC)
- Indigenous Services Canada
- Infrastructure Canada
- Homelessness Policy Directorate (Infrastructure Canada)
- Innovation, Science and Economic Development Canada
- Department of Justice
- Department of National Defence
- Natural Resources Canada
- Public Health Agency of Canada
- Treasury Board of Canada Secretariat
- Veterans Affairs Canada
- Women and Gender Equality Canada (WAGE)
- 2SLGBTQI+ Secretariat (WAGE).
Statistics Canada’s Centre for Indigenous Statistics and Partnerships ran parallel targeted engagement activities with First Nations, Métis and Inuit community members and stakeholders from across Canada. From November 2022 to March 2023, over 30 virtual and hybrid discussion sessions were held to obtain feedback on the census questions that are used to produce data about First Nations, Métis and Inuit populations. Participants represented community members, data users and Indigenous organizations. A summary of these discussions will be published in a separate report.
Chapter 2 – Meeting information needs
2.1 Small geographies and populations of interest
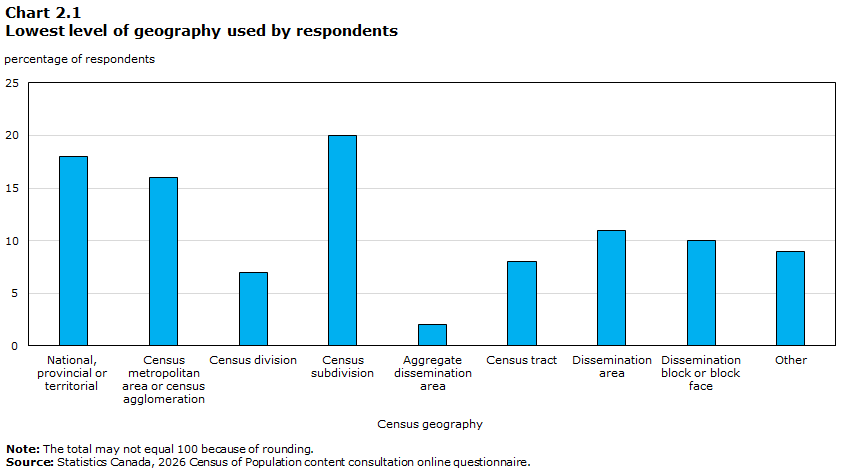
The census is an excellent way to collect and provide data on small geographies and populations of interest because Statistics Canada’s Standard Geographical Classification allows data users to narrow down areas to as small as a block or block face. Respondents were asked to identify the lowest level of geography that they or their organization used and the population groups analyzed when using census data.
Respondents from all user groups showed great interest in being able to access data for areas with small populations. Overall, about 60% of respondents reported that the lowest level of geography used was census subdivision (CSD) or lower (see Chart 2.1). In fact, the CSD was the most frequent response, representing 20% of responses, followed by national, provincial or territorial geographies (18%) and census metropolitan areas (CMAs) (16%).
Data table for Chart 2.1
| Census geography | Percentage of respondents |
|---|---|
| National, provincial or territorial | 18 |
| Census metropolitan area or census agglomeration | 16 |
| Census division | 7 |
| Census subdivision | 20 |
| Aggregate dissemination area | 2 |
| Census tract | 8 |
| Dissemination area | 11 |
| Dissemination block or block face | 10 |
| Other | 9 |
|
Note: The total may not equal 100 because of rounding. Source: Statistics Canada, 2026 Census of Population content consultation online questionnaire. |
|
Despite strong interest in areas with small populations, this was not the most reported lowest level of geography for all user groups. Nearly one-third of federal department respondents (29%) indicated that national, provincial and territorial geographies met their needs, followed by 19% who indicated that CMAs met their needs (see table C.1 in Appendix C). Similarly, one-quarter of NGO or trade union respondents (26%) indicated that national, provincial and territorial geographies met their needs, while 24% indicated that CMAs were the smallest areas they analyzed. Respondents from First Nations, Métis or Inuit NGOs also indicated that national, provincial and territorial geographies met their needs.
Users who reported using other geographies (9%) were asked to specify the other geography. Respondents from municipal governments, academia and the general public reported using other geographies most frequently. The write-in field was analyzed to better understand the other geographies of interest when using census data. Responses most frequently related to the need for custom geographies or geographies at specific municipal or regional levels. Of note, respondents from the First Nations, Métis or Inuit government or leader category specified on- and off-reserve Indigenous geographies. Respondents from the general public and the “other” category, consisting largely of genealogists, accounted for a large portion of those using other geographies.
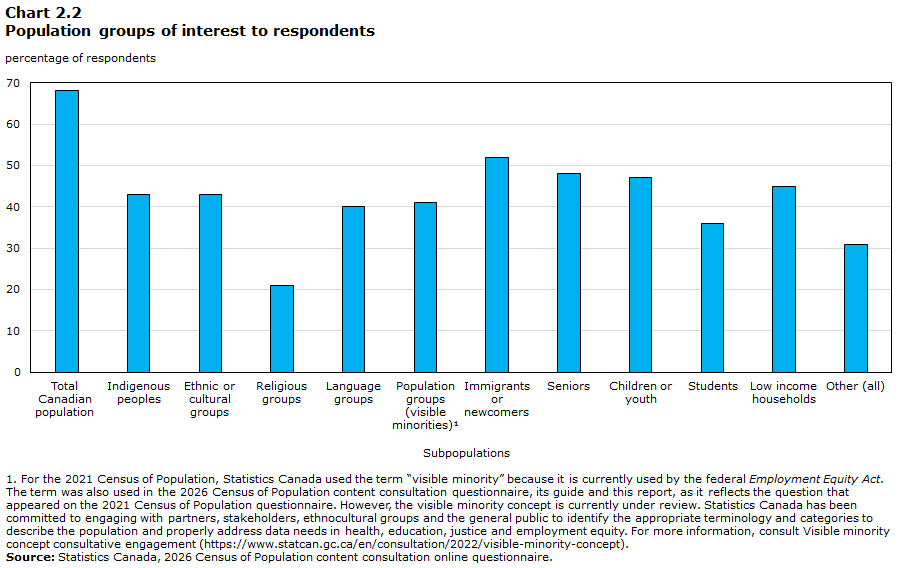
Respondents were interested in a variety of subsets of the population (see Chart 2.2), most commonly reporting that they analyze the total Canadian population (68%), immigrants and newcomers (52%), seniors (48%), and children and youth (47%) when using census data.
Data table for Chart 2.2
| Subpopulations | Percentage of respondents who reported the group is of interest |
|---|---|
| Total Canadian population | 68 |
| Indigenous peoples | 43 |
| Ethnic or cultural groups | 43 |
| Religious groups | 21 |
| Language groups | 40 |
| Population groups (visible minorities)Data table for chart 2.2 Note 1 | 41 |
| Immigrants or newcomers | 52 |
| Seniors | 48 |
| Children or youth | 47 |
| Students | 36 |
| Low income households | 45 |
| Other (all) | 31 |
|
|
“Other” was selected by 31% of respondents, who were then asked to specify their population of interest. The write-in field was further analyzed to better understand the subsets of the population that are of interest to census data users. These included subpopulations identified by their
- geography, such as towns and municipalities, urban or rural areas, provinces or territories, and service areas such as health regions or school districts
- health or disability status
- sex at birth, gender or sexual orientation
- housing status, such as people experiencing homelessness or in housing need, renters, or homeowners.
Many respondents included census variables rather than groups of people to specify other subpopulations of interest when using census data. Some also identified subgroups by census variable, such as workers and commuters, Veterans, and those living in collective dwellings.
2.2 Comparability across Canada
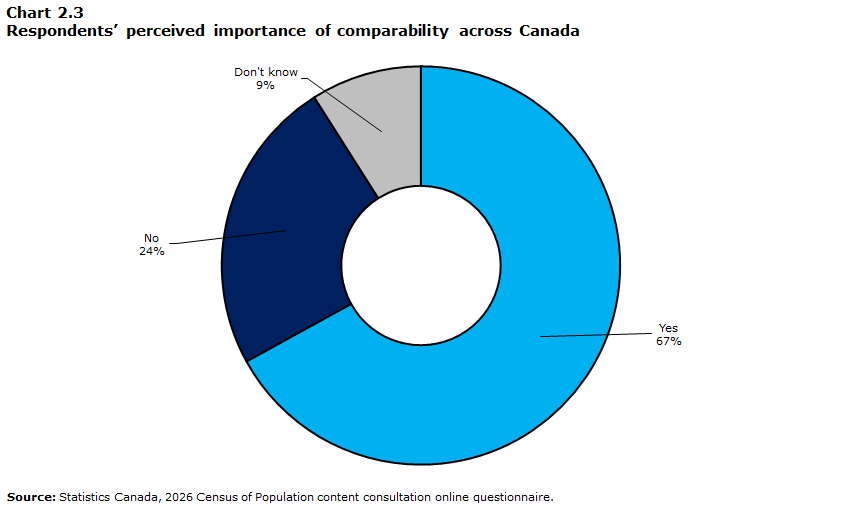
Respondents were asked in broad terms whether it was important for them or their organization to be able to compare census data across Canada. Most respondents (67%) indicated that it was important to be able to compare census data across Canada, whereas nearly one-quarter (24%) reported it was not and 9% did not know.
Data table for Chart 2.3
| Response option | Percentage of respondents |
|---|---|
| Yes | 67 |
| No | 24 |
| Don't know | 9 |
| Source: Statistics Canada, 2026 Census of Population content consultation online questionnaire. | |
The importance of comparability across Canada varied by the type of respondent. Respondents from the federal government (90%), business (87%) and academia (86%) expressed the most need to be able to compare data across the country. Others felt less strongly about this. Respondents from the First Nations, Métis or Inuit government or leaders category (40%) and municipal government respondents (45%) reported a need for comparability across Canada less frequently.
2.3 Continuity over time
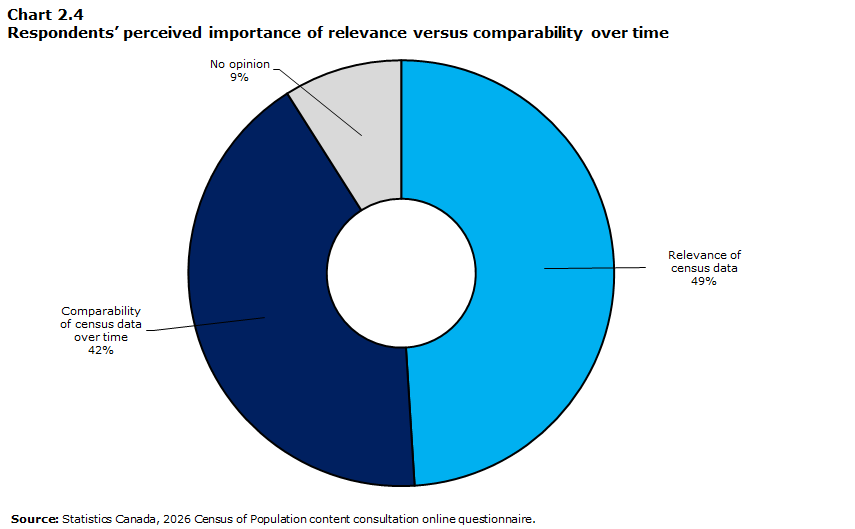
Respondents were asked to answer whether relevance (the degree to which the census data meet current user needs) or comparability of census data over time (the consistency of census content across census cycles) is more important to them or their organization.
Nearly half of respondents (49%) preferred relevant data, while 42% preferred comparability over time and 9% had no opinion.
Data table for Chart 2.4
| Response option | Percentage of respondents |
|---|---|
| Relevance of census data | 49 |
| Comparability of census data over time | 42 |
| No opinion | 9 |
| Source: Statistics Canada, 2026 Census of Population content consultation online questionnaire. | |
Respondents from First Nations, Métis or Inuit NGOs (67%), the federal government (59%), NGOs or trade unions (56%), and provincial and territorial governments (55%) most strongly viewed the relevance of census data as more important than continuity over time. Respondents from the First Nations, Métis or Inuit government or leaders category (60%) favoured continuity over time more than any other user group.
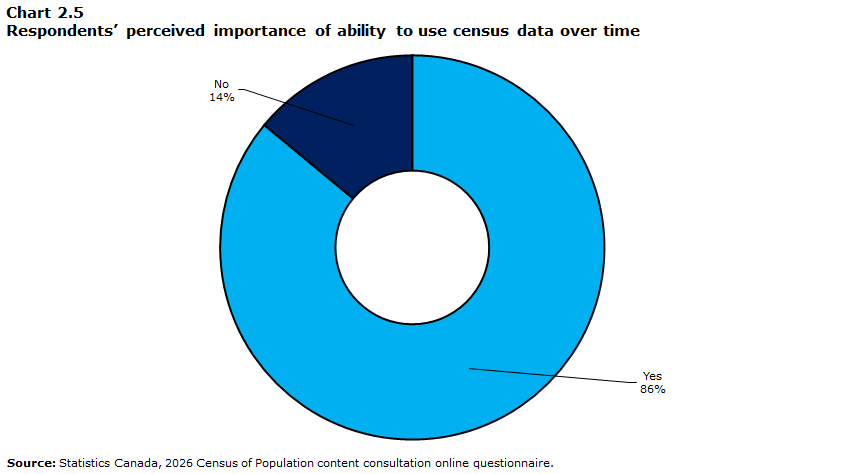
After respondents indicated which census topics they used, they were subsequently asked whether or not they felt it was important to be able to compare the data over time. Overall, 86% of respondents felt it was important to be able to compare the census data they used over time, whereas 14% of respondents did not place importance on comparability over time.
Data table for Chart 2.5
| Response option | Percentage of responses |
|---|---|
| Yes | 86 |
| No | 14 |
| Source: Statistics Canada, 2026 Census of Population content consultation online questionnaire. | |
Respondents did not find continuity over time to be uniformly important across all census topics. For respondents, the most important topics for maintaining the census time series were ethnic or cultural origins (100%), income (91%) and labour market activities (90%), while the least important topics for maintaining the census time series were Canadian military experience (77%), religion (80%), and language of instruction (80%). Note that questions related to Canadian military experience and language of instruction were newly added in 2021, and data on religion are collected only in the decennial census (censuses conducted in the years ending in “1”). As such users may not consider these topics when assessing the importance of continuity over time in the same manner as other topics, which could help explain these results.
2.4 Multivariate analysis
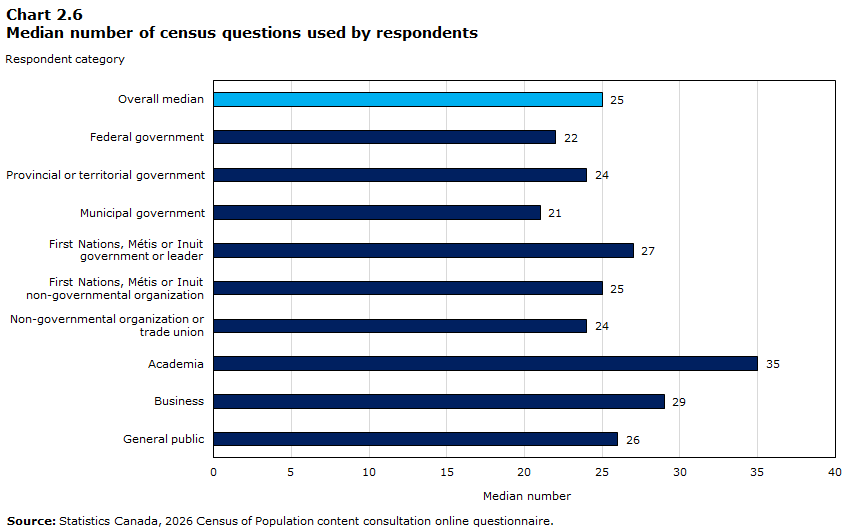
During consultation, respondents were asked to indicate which of the 89 questions collected on the 2021 Census long-form questionnaire they used for analysis (see Appendix F). Engaging in multivariate analysis allows users to examine interrelationships in the data. An example may include crossing age, education, income and immigrant status to analyze data trends. This type of analysis is possible with the census because data are available for each individual and household.
The median number of questions used by respondents was 25 (see Chart 2.6). The number of questions used varied by respondent group, ranging from 21 for federal government respondents to 35 for academics.
Data table for Chart 2.6
| Respondent category | Median number |
|---|---|
| Overall median | 25 |
| Federal government | 22 |
| Provincial or territorial government | 24 |
| Municipal government | 21 |
| First Nations, Métis or Inuit government or leader |
27 |
| First Nations, Métis or Inuit non-governmental organization |
25 |
| Non-governmental organization or trade union |
24 |
| Academia | 35 |
| Business | 29 |
| General public | 26 |
| Source: Statistics Canada, 2026 Census of Population content consultation online questionnaire. | |
While the consultation did not ask respondents why they used their specified number of questions, we can assume that how respondents use the full range of data reflects their objectives. For example, one data user may narrowly focus on delivering one service to a particular population group, whereas another user may be more broadly concerned with a full range of activities, including planning, delivering services or programs, monitoring and evaluating needs, and running complex models.
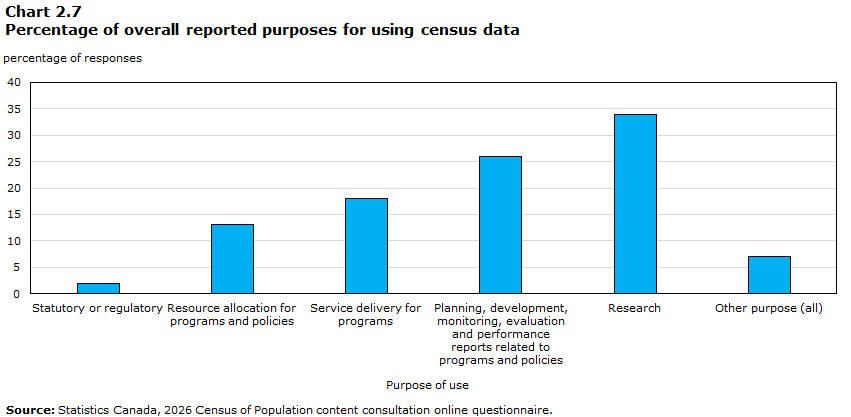
2.5 Overall reported purposes for using census data
Respondents were asked whether they used census data for the following purposes:
- statutory or regulatory purposes
- resource allocation for programs and policies
- service delivery for programs
- planning, development, monitoring, evaluation and performance reports related to programs and policies
- research or other uses.
Respondents were asked to identify all applicable purposes of use for each census question they reported using for analysis. The extent to which census data users’ needs are met is an important factor in the content determination framework and thus in determining the content of the 2026 Census of Population.
Data table for Chart 2.7
| Purpose of use | Percentage of responses |
|---|---|
| Statutory or regulatory | 2 |
| Resource allocation for programs and policies | 13 |
| Service delivery for programs | 18 |
| Planning, development, monitoring, evaluation and performance reports related to programs and policies | 26 |
| Research | 34 |
| Other purpose (all) | 7 |
| Source: Statistics Canada, 2026 Census of Population content consultation online questionnaire. | |
Across all respondent categories and census topics, respondents indicated using census data for research purposes most frequently. This purpose was selected by 72% of respondents (see Appendix D) and accounted for 34% of the reported uses of census data (see chart 2.7). Planning, development, monitoring, evaluation and performance reports related to programs and policies represented one-quarter (26%) of reported uses of census data and was selected by 63% of data users. Nearly half of data users selected service delivery for programs (47%) or resource allocation for programs and policies (41%), and these uses represented less than one-fifth of the reported uses of census data (18% and 13%, respectively). Statutory or regulatory purposes were the least frequent uses overall, selected by 12% of data users and representing 2% of reported uses of census data. A small number of other purposes (7%) for using census data were reported by 20% of respondents.
Respondents from the government and the NGO or trade union categories reported similar purposes for using census data. Respondents from all respondent categories were interested in census data for resource allocation for programs and policies, and service delivery for programs. Research purposes were more frequently reported by academia, business, the general public and other respondents; these respondents have less need for census data for planning purposes.
2.6 Statutory and regulatory purposes
Census data were sometimes used to support legislation and regulations. This is the least frequently reported (2%), but most important, use of census data. As set out in the content determination framework, statutory and regulatory uses tied to a law and information needs that serve a purpose that is national in scope are given the highest priority.
The census questions most used for statutory or regulatory purposes were the demographic and language questions. All other census questions were selected to be used for statutory or regulatory purposes much less frequently.
Government respondents tended to use the census for purposes tied to laws more than the other data user groups, accounting for over 60% of the reported statutory or regulatory use of census data. Those from municipal governments were the largest user group, representing 35% of reported statutory or regulatory use, followed by those in the federal government (21%) and the NGO or trade union (21%) categories.
Respondents who used data for statutory or regulatory purposes were also asked to specify the relevant laws, statutes or regulations. The write-in field was analyzed to better understand the laws or regulations for which census data are used. The broad-ranging answers were organized into 24 themes for analysis. Across all census topics, purposes related to the Canadian Charter of Rights and Freedoms, including minority language rights, were most frequently mentioned by data users (16% of responses). Specifically, section 23 of the charter was often mentioned. The Official Languages Act accounted for 7% of responses.
Note: Section 23 of the Canadian Charter of Rights and Freedoms guarantees minority language educational rights to French-speaking communities outside Quebec and to English-speaking minorities in Quebec.
Respondents frequently included answers related to zoning and development by-laws, urban planning, transit or transport, such as the Planning Act (11%). Respondents broadly mentioned laws and regulations related to multiculturalism, diversity, equity and inclusion, such as the Employment Equity Act or the Anti-Racism Data Standards, including the Federal Contractors Program (10%).
Respondents included a wide range of acts and regulations when specifying their census data use for statutory or regulatory purposes, such as
- Accessible Canada Act
- Canada National Parks Act
- Canadian Charter of Rights and Freedoms
- Condominium Act
- Constitution Act
- Education Act
- Employment Equity Act
- Employment Standards Act
- Engineering and Geoscience Professions Act (Alberta)
- Health Protection Act
- Human Rights Code
- Indian Act
- Labour Standards Act
- Manitoba Building Code
- Planning Act (Manitoba)
- Municipal Act
- National Housing Strategy Act
- Official Languages Act (New Brunswick)
- Nunavut Land Claims Agreement Act
- Official Languages Act
- Ontarians with Disabilities Act
- Anti-Racism Data Standards (Ontario)
- Development Charges Act (Ontario)
- Employment Standards Act (Ontario)
- Health Protection and Promotion Act (Ontario)
- Planning Act
- Public Health Act
- Residential Tenancies Act
- Statistics Act
- Veterans Well-being Act
- Department of Veterans Affairs Act
Not all of these laws and regulations cite the census. In fact, relatively few cite it. However, organizations use census data to support legislation implementation and reporting.
2.7 Resource allocation for programs and policies
Resource allocation for programs and policies accounted for 15% of respondents’ overall reported purposes for using census data. As set out in the content determination framework, uses related to resource allocation are also given high priority because of their direct effect on government spending and financial decisions.
This reported data use was fairly consistent across topics. Government respondents tended to use the census for this purpose more than the other data user groups. Respondents from municipal governments were the largest user group, representing 31% of the reported use for the purpose of resource allocation, followed by those from NGOs or trade unions (20%) and the federal government (15%).
2.8 Service delivery for programs
Service delivery for programs accounted for 20% of respondents’ overall reported purposes for using census data. As set out in the content determination framework, uses related to service delivery are also given high priority because of their direct effect on government spending and financial decisions. As with the previous data use purpose, the distribution of the data use for this purpose is fairly consistent across census topics. Municipal government respondents (30%) were the largest users of census data for service delivery for programs across all census topics (they reported using census data for this purpose twice as often as respondents from the federal government [14%]). Notably, municipal government respondents showed the most interest in using data related to place of work and commuting (36%), mobility (37%), and housing (38%) for the purpose of service delivery. The second most frequent users of data for this purpose were from NGOs or trade unions (22%), who responded in a similar pattern as respondents from municipal governments.
One-third of the reported use of Canadian military experience data for service delivery for programs was from federal government respondents (32%). These respondents were also the second-largest users of data on Indigenous populations (26%) and frequent users of population group (visible minority)Note 1 data (23%) for this purpose. The use of data related to activities of daily living (ADL) for service delivery for programs was mostly reported by NGOs or trade unions and municipal governments, each accounting for 27% of the response.
2.9 Planning, development, monitoring, evaluation and performance reports related to programs and policies
The purpose of planning, development, monitoring, evaluation and performance reports related to programs and policies was the second most reported use of census data overall, accounting for 26%. While frequently reported, this use is assigned a medium priority under the content determination framework because it measures accountability and informs Canadians about the efficiency and effectiveness of government programs.
Respondents from municipal governments reported the most use for this purpose across all census questions. Most notably, they represented the largest percentage of users of housing (36%), mobility (36%), and place of work and commuting (35%) data, more than double the reported use of other government-level respondents. Respondents from NGOs or trade unions reported significant use of all census questions for this purpose. Notably, they are responsible for nearly one-quarter of the use of data on instruction in the minority official language (23%) and ADL (23%). This is similar to the level reported by municipal governments. Questions on place of birth, immigration and citizenship, ethnic or cultural origins, and population group (visible minority) had similar patterns of reported use for this purpose across all respondent categories. Data on Indigenous population groups were reportedly most used for planning, development, monitoring, evaluation and performance reports related to programs and policies by respondents from municipal governments (25%), followed closely by respondents from the federal government (22%) and NGOs or trade unions (17%).
2.10 Research purposes
Although research was the most frequently reported purpose of use overall, uses such as academic and policy research are assigned a lower priority by the content determination framework. As with the previous data use purposes, all census topics were reportedly used for research purposes fairly consistently. However, questions related to demography (9%) were reportedly the most used for research, followed by place of birth (8%), and immigration and citizenship (8%).
Grouped together, federal, provincial or territorial, and municipal government respondents accounted for about 30% of the reported use for research across all census questions.
Respondents from the general public (25%) reported using census data for research purposes most frequently, followed by those in academia (16%), NGOs or trade unions (15%), the federal government (12%), and provincial or territorial and municipal governments (13%). The general public led the use for research for almost all census topics, except population group (visible minorities) and Indigenous Peoples. Respondents from the general public were by far the largest users of data on religion (38%) and Canadian military experience (47%) for research, more than double those from academia, who accounted for 16% and 11%, respectively.
2.11 Other purposes
The write-in field was analyzed to better understand the other reported purposes respondents had for using census data. Responses most frequently related to uses for genealogy (38%) or general interest, general information, learning, teaching or training (10%), among other general trends. Note that more than 30% of the responses were deemed to fall within the existing purposes and were recoded as such.
Chapter 3 – Perceived data gaps in the census content
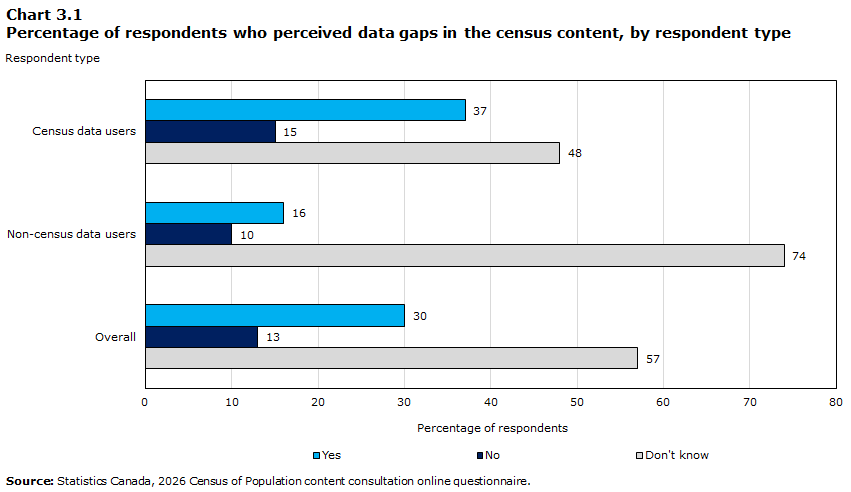
All consultation respondents were asked whether there are data gaps in the content of the Census of Population that need to be addressed. Regarding the existence of data gaps in the census content, 57% of respondents answered “Don’t know,” 30% indicated “Yes” and 13% indicated “No” (see Chart 3.1).
For respondents who identified as census data users, the perception of gaps increased: 37% of census data users responded “Yes,” 15% responded “No” and close to 50% responded “Don’t know.”
Of the respondents who did not identify as census data users, 16% indicated that “Yes,” there are data gaps that need to be addressed. This response could suggest that the perceived data gaps in the census content are the reason these respondents do not (yet) use the census data. Most respondents who did not indicate using census data (74%) answered “Don’t know” when asked about data gaps.
Note that a response of “Don’t know” does not necessarily indicate that a respondent feels the census content is complete. Rather, this response could indicate a lack of data literacy or knowledge about the census content or the Census Program, or issues with accessing available census data. This may help the Census Program identify areas of improvement, such as data literacy and data access.
Data table for Chart 3.1
| Response option | Respondent type | ||
|---|---|---|---|
| Census data users | Non-census data users | Overall | |
| percentage of respondents | |||
| Yes | 37 | 16 | 30 |
| No | 15 | 10 | 13 |
| Don't know | 48 | 74 | 57 |
| Source: Statistics Canada, 2026 Census of Population content consultation online questionnaire. | |||
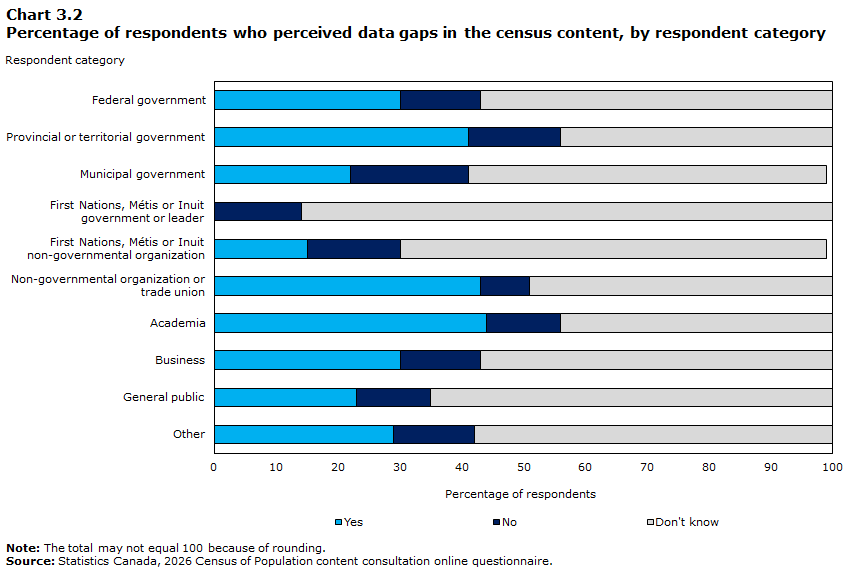
Respondents from all categories shared their views about data gaps in the census content (see Chart 3.2). Respondents from academia (44%), NGOs or trade unions (43%) and provincial or territorial governments (41%) felt most strongly that there are data gaps in the census content. The majority of business respondents (58%), along with those from the federal (57%) and municipal (58%) governments, responded most often with “Don’t know.” Respondents from the First Nations, Métis or Inuit government or leader category (86%) and the First Nations, Métis or Inuit NGO category (69%) also responded most often with “Don’t know.” Municipal government respondents felt most strongly that census content was complete, as 19% reported that no data gaps needed to be addressed.
Data table for Chart 3.2
| Respondent category | Yes | No | Don't know | Total |
|---|---|---|---|---|
| percentage of respondents | ||||
| Federal government | 30 | 13 | 57 | 100 |
| Provincial or territorial government | 41 | 15 | 44 | 100 |
| Municipal government | 22 | 19 | 58 | 100 |
| First Nations, Métis or Inuit government or leader |
0 | 14 | 86 | 100 |
| First Nations, Métis or Inuit non-governmental organization |
15 | 15 | 69 | 100 |
| Non-governmental organization or trade union |
43 | 8 | 50 | 100 |
| Academia | 44 | 12 | 44 | 100 |
| Business | 30 | 13 | 58 | 100 |
| General public | 23 | 12 | 66 | 100 |
| Other | 29 | 13 | 58 | 100 |
|
Note: The total may not equal 100 because of rounding. Source: Statistics Canada, 2026 Census of Population content consultation online questionnaire. |
||||
Respondents who believed there are data gaps in the census content were subsequently asked to indicate up to five data gaps they felt should be addressed in future census questionnaires, as well as how the new data would be used, and to identify any known alternative sources for the data. Five individual text fields with a 60-character limit were provided to answer this question, and respondents were asked to rank the gaps in order of importance. At least one of the five data gap fields were filled out by 873 respondents, for a total of 2,290 individual data gaps reported by 30% of respondents. On average, three gaps were reported per respondent. Each entry was reviewed and categorized manually, and the reported data gaps were categorized into 32 different themes (see Appendix E).
The top three themes were reported close to three or four times more frequently than all other identified themes, each accounting for under 5% of responses. Because most data gaps were reported infrequently, only the most notable themes are described in this report.
Gaps were reported by all respondents, except by those in the First Nations, Métis or Inuit government or leader category. Aside from the general public (27%), respondents from NGOs or trade unions reported the most data gaps, representing 21% of the information collected. Respondents from academia (12%), the federal government (11%), municipal governments (11%), provincial or territorial governments (8%), and business (7%) reported gaps at somewhat even rates.
Respondents reported data gaps and assigned importance in similar patterns across all five ranking fields. Overall, 16% of reported data gaps were related to the theme of disability, health, mental health, ADL and well-being. Across all respondent categories, this was the most frequently reported and the most highly ranked data gap theme. This top theme was most frequently reported by respondents from NGOs or trade unions, the general public, academia and the federal government.
The second most frequently reported data gaps were related to the theme of housing status, dimensions of housing need, homelessness and dwelling characteristics, representing 9% of responses and reported relatively evenly by all contributing respondent categories. This was followed closely by gaps related to the sex at birth, gender and sexual orientation theme, which represented 8% of responses and was of most interest to respondents from the federal government and the general public, followed by respondents from NGOs or trade unions and academia.
Federal government respondents reported gaps mostly related to these top three themes. They also reported gaps related to labour market activities, Indigenous Peoples and population group (visible minority). Gaps reported by provincial government respondents were most often related to labour market activities, followed by expenditures, payments, monthly bills and cost of services, as well as the top three themes. Municipal government respondents provided answers broadly across all themes but were the most prominent reporters of gaps related to geography, and transportation modes, movements and travel, in addition to the top three themes.
Respondents from NGOs or trade unions provided the most data gap suggestions across the largest number of themes, notably
- unpaid work, caregiving and volunteering
- coverage, secondary residences, and who and where to include
- leisure, hobbies, perceptions of life, sociospacial contributors to quality of life and satisfaction, and access to public supports and services
- expenditures, payments, monthly bills and cost of services.
Responses from First Nations, Métis or Inuit NGOs were evenly split between the themes of sex at birth; Indigenous Peoples; place of work, journey to work and work from home; and housing, housing status, dimensions of housing need, homelessness and dwelling characteristics.
Business respondents identified gaps in all themes, but the bulk of their input centred around expenditures, payments, monthly bills and cost of services; housing status, dimensions of housing need, homelessness and dwelling characteristics; and disability, health, mental health, ADL and well-being. Respondents from academia also identified data gaps broadly. In addition to the top three themes, they showed interest in transportation modes, movements and travel, and labour market activities.
Suggestions from the general public were proportionally high. However, the bulk of responses was related to the top theme of disability, health, mental health, ADL and well-being.
3.1 Alternative data sources
In assessing the suitability and availability of alternative data sources in consideration of census data users’ needs, the consultation framework assigns the highest priority to the topics for which no alternative data sources exist, while those for which alternative data sources are readily available are the lowest priority.
During consultation, respondents who identified perceived data gaps in the census content were also asked whether they knew of other data sources that could provide information on what they felt should be addressed by the Census of Population. The majority responded either “No” (54%) or “Don’t know” (22%) to this question, while 25% reported that they knew of other data sources and reported at least one of them.
Of the respondents who reported data gaps related to collective dwellings, 70% reported having no knowledge of other data sources, as did over 60% of those who reported data gaps about population group (visible minority); language of instruction; Canadian military experience; geography; religion; expenditures, payments, monthly bills and cost of services; and unpaid work, caregiving and volunteering.
Respondents significantly more often reported having no knowledge of other data sources that could provide information on the most frequently reported and most highly ranked data gap themes: disability, health, mental health, ADL and well-being (52% of respondents reported “No,” 25% reported “Don’t know” and 22% reported “Yes”); housing, housing status, dimensions of housing need, homelessness and dwelling characteristics (47% reported “No,” 25% reported “Don’t know” and 28% reported “Yes”); and sex at birth, gender and sexual orientation (49% reported “No,” 29% reported “Don’t know” and 22% reported “Yes”).
Conversely, 49% of respondents who reported data gaps in transportation modes, movements and travel also reported having knowledge of other data sources that could provide information on the perceived data gaps. However, in the case of all the other themes, one-third of respondents or less reported knowing of alternative data sources.
A large proportion of the alternative data sources reported were other Statistics Canada surveys, such as the Labour Force Survey, the Canadian Community Health Survey and the General Social Survey. Other frequently mentioned surveys were the Canadian Survey on Disability (CSD) and the Indigenous Peoples Survey (IPS), which are postcensal surveys that use census content to create survey frames. Other reported alternative data sources include tax data, vital statistics, various datasets from the provinces and territories, land registries, utility information, school registration, and various sources of data from municipalities.
Statistics Canada is continuously exploring new datasets and assessing their suitability to help supplement or replace content on the Census of Population. Alternative sources must satisfy several factors before they can be considered viable providers of census content. Alternative sources must capture similar concepts as the census, be reliable sources of information on populations and dwellings across Canada, use similar reference periods as the census, be of high quality, and be accessible to Statistics Canada. In fact, in most surveys, the census provides the essential benchmark to ground survey responses to the Canadian population.
Alternative data sources can improve census accuracy and reduce respondent burden. Statistics Canada currently uses administrative datasets, such as income and immigration data, to supplement the census and replace questions that used to appear on the questionnaire.
Chapter 4 – Stakeholder discussions and qualitative testing summaries by topic
In addition to the online consultation, Statistics Canada met virtually with stakeholders from federal departments and other interested organizations for discussions, wherein detailed descriptions of their data needs and uses were provided. Following the end of the content consultation period, Statistics Canada undertook multiple rounds of qualitative testing. Through cognitive one-on-one interviews in summer 2023, Statistics Canada collected feedback from Canadians about possible changes to the census questions. Statistics Canada considered the results and input from all consultative and testing activities to determine the proposed changes that will undergo quantitative testing during the 2024 Census Test.
The following chapter summarizes the information needs by census topic, the qualitative testing undertaken as a result and how preparations for the 2024 Census Test will help meet these needs.
4.1 Enumerating households and people
Under the de jure enumeration method used in Canada’s Census of Population, the population is enumerated based on a “usual place of residence,” that is, by the location where a person lives most of the time. Census enumeration involves listing all usual residents of a dwelling on Census Day.
Stakeholder discussions
Population counts are essential for stakeholders at the federal, provincial and municipal levels to properly plan services and allocate resources at all levels.
Qualitative testing
Accurately enumerating Canada’s population is crucial to the census. Some proposed changes were qualitatively tested in 2023 to ensure that residents are correctly enumerated and to decrease the double counting of people with more than one usual residence. These changes will be tested quantitatively in 2024 to ensure that residents are correctly enumerated and to decrease the burden on respondents.
4.2 Demography: Age, sex at birth, gender and household composition
These questions provide information about how and with whom people in Canada live: living arrangements, family size, the number of children living with one or two parents and the number of people living alone.
Demographic variables have always been crucial to the census. In 1871, the first Canadian census collected information on the name, age, sex and marital status of every member of the household. The relationship of the members of the household to “Person 1” (formerly “head of household”) was added to the 1891 Census of Population. In 2021, Statistics Canada began collecting information on gender in addition to sex at birth to fill information gaps on gender-diverse Canadians.
Stakeholder discussion
This information is used to plan social programs such as Old Age Security and the Canada Child Benefit. Municipalities also use it to plan a variety of services, such as daycare centres, schools, police, fire protection and residences for older adults. Demographic variables were used by all stakeholders across all categories of data users. Uses varied across departments, agencies and organizations to fulfill statutory and regulatory purposes, inform and evaluate service delivery and programs, and conduct research. These variables were crossed with many other census topics to evaluate the socioeconomic situations of Canadians.
Qualitative testing
Multiple changes to the demography and household composition modules were tested qualitatively in 2023.
The sex at birth and the date of birth questions were reversed from how they appeared in 2021, so the date of birth question appears first, followed by the gender and sex at birth questions. The gender response categories were modified to include “man” and “woman,” and “boy” and “girl” for those younger than 15 years. These changes were made as per recommendations from stakeholders and the new Statistics Canada standard for collecting the sex at birth and gender variables and will be tested quantitatively in 2024.
A new “couple relationships” module was tested qualitatively in 2023 to replace the marital status module. This change was made to test response options and capture the increasingly diverse conjugal situations in Canada, to improve terminology around cohabiting unions (particularly in Quebec), to minimize the use of legal jargon, and to identify people who live apart from their spouse or partner. Many of these tested changes were incorporated into a revised marital status module that will be further tested quantitatively, though the measurement of people in a relationship with someone who lives outside the household was not moved forward for quantitative testing.
Modifications to the format and the order of the household composition and marital status modules were also tested in 2023. These changes include updated response categories for the relationship to Person 1 and more inclusive relationship terminology. The revised relationship options remove the need for household members to be listed in a certain order therefore reducing respondent burden and confusion. The household relationship and marital status questions were reordered and the logic of the questionnaire was changed to allow certain individuals and households to bypass some questions, thereby reducing the burden on a substantial portion of respondents. These changes will be further tested quantitatively in 2024.
4.3 Sexual orientation
In the spring of 2021 Statistics Canada undertook a Public Consultation on Gender and Sexual Diversity Statistical Metadata Standards. The purpose of the consultation was to seek feedback specifically on the proposed updates to the standard for gender of person and new standards for sexual orientation and LGBTQ2+Note 2 status. Statistical standards for gender and sexual diversity (such as the definition of each concept and the classification which establishes its categories) allow for the reporting of statistically diverse groups of the population in a consistent manner. In addition to this public consultation, virtual meetings were organized with key stakeholders and researchers to gather their feedback.
In response to the requests from users and the feedback heard through this consultation, which was held separately from the census content consultation, Statistics Canada developed and released a new standard on sexual orientation that was approved as a recommended standard on June 13, 2023. For information on the results of this public consultation, refer to the 2021 Public Consultation on Gender and Sexual Diversity Statistical Metadata Standards - What We Heard Report, and for information on the standards, refer to Sex, gender, sexual orientation standards.
Results from the 2026 online content consultation with data users showed that having more granular data on sex at birth, gender and sexual orientation was one of the most frequently reported perceived data gaps in the census content.
Stakeholder discussion
Discussions with federal partners and academics showed the need to collect data on sexual orientation. Participants shared that collecting this information in the census would allow for multivariate analysis with other census variables and provide valuable information about LGB+ individuals in Canada, helping to inform evidence-based policies and programs that address and monitor the inequities they face.
Stakeholders and data users have identified a need for collecting sexual orientation data in the census to support Canada’s 2SLGBTQI+ Action Plan, which aims to strengthen data and evidence-based policy making for 2SLGBTQI+ populations. Discussions with stakeholders underlined that data on sexual orientation are not included in any national administrative databases and that surveys conducted by other federal departments, provinces or territories, academia, or NGOs either are non-representative, are not conducted at the national level, or have small sample sizes of LGB+ people. Thus, they are not a viable option to obtain sample sizes of LGB+ people that are sufficient to disaggregate data by specific sexual orientation.
Qualitative testing
As a result of the consultation, the inclusion of sexual orientation was explored through extensive qualitative testing in 2023; however, the question will not be included in the 2024 Census Test. Sexual orientation continues to be assessed and further evaluated for inclusion in the Census through other methods.
4.4 Languages and language of instruction
Language questions are used to provide a profile of the linguistic diversity of Canada’s population. This information is used to estimate the need for services in English and French across the country and to better understand the current state and evolution of Canada’s various language groups, including official languages, Indigenous languages and immigrant languages.
Questions on the knowledge of official languages and mother tongue first appeared in the 1901 Census. A question on language spoken at home was added in 1971, and one on the knowledge of non-official languages was introduced in 1991. The concept of language used at work was added to the 2001 Census.
In 2021, questions about the language of instruction were added to the census short-form questionnaire to enumerate minority language rights holders as defined by section 23 of the Canadian Charter of Rights and Freedoms. This enumeration was mandated per recommendations from the federal Standing Committee on Official Languages.
Stakeholder discussion
Stakeholders who use these data indicate using them to evaluate the need for services and program delivery at the federal, provincial and municipal levels in different languages across the country.
Qualitative testing
Minor changes to the language module were tested to better align the English version of the question on the knowledge of non-official languages with the French version, and help text was added to instruct sign language users on how to respond. The logic of the questionnaire was changed to allow the questions on the language of instruction to be bypassed for children younger than 3 years, thereby reducing the burden on a portion of respondents. These changes will be tested quantitatively in 2024.
4.5 Canadian military experience
The question on Canadian military experience is used to determine the number of Canadian Veterans and those who are currently serving as members of the Canadian Armed Forces. The main purpose of the question, which was added to the short-form questionnaire in 2021, is to address known data gaps in historical administrative records and better serve this population by informing various policies and programs administered by Veterans Affairs Canada, the Department of National Defence, the Canada Mortgage and Housing Corporation, and other Veteran support organizations.
Stakeholder discussion
Stakeholders at the federal level reported using data from 2021 to fill gaps in administrative data and create profiles of Veterans in Canada using other census variables. A need to improve the quality of the data collected in 2021 to better enumerate the Veteran population, including their characteristics (e.g., Reserve Force versus Regular Force, era of service), was also reported. Through consultation and analysis following the 2021 Census of Population, Statistics Canada heard that some respondents had difficulty identifying whether their service was applicable to the census question because of the terminology used and the exclusion of some branches.
Qualitative testing
Structural changes were tested qualitatively in 2023 to reduce confusion for respondents and improve the data quality from 2021. The question on Canadian military experience was revised to be more inclusive of all branches, such as the Cadet Organizations Administration and Training Service (COATS) and the Canadian Rangers, with additional options for respondents to select all types of service that apply and a write-in field to specify other details. These changes and the placement of the question on the long-form questionnaire will be tested quantitatively in 2024 to ensure they can provide improved results.
4.6 Activities of daily living
This question provides information about people in Canada who may have a long-term difficulty or health condition. Physical and non-physical conditions, such as mental health and cognitive difficulties, are included. Statistics Canada uses this information to identify people who are likely to have a disability as potential respondents for the Canadian Survey on Disability (CSD), a national survey of Canadian adults whose everyday activities are limited because of a long-term condition or health-related problem. The CSD was developed by Statistics Canada in collaboration with Employment and Social Development Canada.
Note that the data on activities of daily living (ADL) from the 2021 Census are available to users upon special request only. They are not disseminated publicly and include a number of caveats for use. As the primary purpose of these data is to identify participants for the CSD, which includes further questions to identify disability, these data receive minimum edits. Their use is cautioned, as this question alone does not provide an estimate of disability in Canada.
The information from the questions on ADL is also used to monitor the new Accessible Canada Act and to support policy and program development by governments and organizations. People with disabilities are one of the four designated employment equity groups under the Employment Equity Act.
The 1871 Census of Population and subsequent censuses collected information on infirmities. Questions on activity limitations first appeared in the 1986 Census.
Stakeholder discussion
As observed from the consultation questionnaire results, stakeholders indicated great interest in more data from the census on disability, general health and ADL. This was the most frequently reported data gap perceived in the census content.
Stakeholders expressed interest in the wider dissemination of ADL information for broad uses, namely for understanding the health and well-being of Canadians through multivariate analysis with the other socioeconomic variables available from the census. Stakeholders expressed interest in further using census data to help develop and implement various programs and legislation that support individuals with disabilities in Canada.
Qualitative testing
Small updates to the ADL questions were tested qualitatively in 2023. The concept of “difficulty” was added when considering the effect of mental health conditions or other long-term health conditions on daily living, rather than simply the presence of these conditions. Additionally, terminology was updated to use the non-stigmatizing term “substance use disorder.” These small modifications will be tested qualitatively in 2024 to ensure they improve respondents’ understanding of the question.
4.7 General health
Results of the content consultation process pointed to data users’ strong need for health-related information, as was seen with the ADL data. In response, Statistics Canada has explored the addition of a general health question on the long-form questionnaire for the 2026 Census of Population.
General health, also referred to as perceived health, is an indicator of overall health status. It refers to the perception of a person’s general health, either self-reported or, in the case of a proxy response, reported by the person answering the survey questionnaire on behalf of the intended respondent. Health means not only the absence of disease or injury but also the presence of physical, mental and social well-being. Perceived health reflects aspects of health that are not captured in other measures, such as incipient disease, disease severity, aspects of positive health status, physiological and psychological reserves, and social and mental function. This indicator is measured in a number of Statistics Canada surveys and is aligned with the Quality of Life Framework.
Stakeholder discussion
Information on the general health of Canadians was requested by federal partners such as the Public Health Agency of Canada and Health Canada, as well as municipal stakeholders to support research in the health of small populations identified in the census and to disaggregate the data to inform resource allocation, service planning and policy making by all levels of government. This was the most frequently reported data gap perceived in the census content.
Qualitative testing
Statistics Canada’s general health question was tested qualitatively in 2023, with a slight change to allow for proxy reporting in the census. It was placed in a different location on the questionnaire than where it appeared in the 2019 Census Test. This question will be tested quantitatively in the new location in the 2024 Census Test.
4.8 Immigration, place of birth and citizenship
Questions on the place of birth of household members and their parents provide information about the diversity of Canada’s population and the migration of people within Canada and from other countries to Canada. They are used to assess the social and economic conditions of second-generation Canadians and help understand Canada’s immigration history.
The census has a long tradition of including these questions. Information on place of birth was first collected on the 1871 Census. A question on parents’ place of birth was added in 1891. Information on citizenship and year of immigration was first collected in the 1901 Census, and a question on landed immigrant status was first asked in 1991.
Over the last two census cycles, Statistics Canada has integrated IRCC’s administrative records into the census. Starting in 2016, new immigration variables on admission category and applicant type were added to the census. Then, in 2021, the questions on immigrant status and year of immigration were replaced by IRCC’s administrative records. Using administrative data not only reduces collection costs and the burden on Canadians but also provides more accurate information.
Stakeholder discussion
This information is required by IRCC and provincial and territorial immigration departments to develop and monitor immigration policies and programs. It is also used in support of the Immigration and Refugee Protection Act, the Citizenship Act, the Canadian Human Rights Act, and the Canadian Multiculturalism Act.
Data on immigration, place of birth and citizenship are used by stakeholders to compare the social and economic conditions of immigrants in Canada over time; to evaluate immigration and employment policies and programs; and to plan education, health and other services. These data are also used at the federal, provincial and municipal levels to identify migration patterns, human behaviour in relation to infrastructure, the characteristics of communities and their needs, and the effects of programming over time and across the country.
Qualitative testing
Small changes to the question identifying a person’s citizenship of a country other than Canada were tested qualitatively in 2023 to clarify the response categories for respondents and improve data quality. Additionally, changes to the order of the response categories for the question identifying the place of birth of one’s parents were tested to improve data quality and understanding. These changes will be tested quantitatively in 2024.
4.9 Ethnocultural diversity: Ethnic or cultural origins, population group (visible minority) and religion
The questions on ethnic or cultural origins, population groups (visible minorities) and religion reflect the longstanding and widespread demand for information on the origins and ethnocultural composition of Canada’s population. The census is the best tool for obtaining information on these groups at all levels of geography.
Information on ethnic or cultural origin was first collected in the 1871 Census. A “racial origin” question first appeared in the 1901 Census. The population group question (collecting information on groups specified in the Employment Equity Act) first appeared in the 1996 Census. Information on religion also has a long history on the Census of Population questionnaire appearing only on decennial censuses; it was first collected in 1871.
Stakeholder discussion
These variables are used for a variety of purposes by federal, provincial and municipal partners; academics; and respondents in the private sector. These data are required to examine the socioeconomic characteristics of Canadians and to evaluate programs aimed at providing equal opportunity, such as employment equity initiatives. Stakeholders also use these variables as a part of the demographic characteristics of communities to better plan service delivery.
Associations, agencies and researchers use this information for activities such as health promotion, communications and social support programs. Governments, businesses, community groups, health care providers, researchers and a variety of organizations throughout the country use the data from the population group question to support programs that provide equal opportunity for everyone to share in the social, cultural and economic life of Canada.
Stakeholders reported an increased need to measure the rapid growth of certain religious groups observed since 2011 and to respond to the rapid changes in Canadian society through immigration and the increased diversity of the population, trends that are expected to continue over the next several years. The religion variable is used by stakeholders as a benchmark and to support the development of programs to combat racism and hate, in compliance with Canada’s Anti-Racism Strategy and the Action Plan on Combatting Hate. In addition, it is used for research on immigration, social well-being and discrimination.
These variables also meet the need to provide information on Canada’s diverse population in support of the Employment Equity Act. Data from these questions are used to inform federal multiculturalism programs and policies and support the Canadian Multiculturalism Act and the Canadian Human Rights Act. This information is also used by various community organizations, such as religious denominations and cultural associations.
Qualitative testing
Minor changes to the list of examples of ethnic or cultural origins and updates to the instruction text were tested qualitatively in 2023 to clarify what is required from respondents. These will also be tested quantitatively in the 2024 Census Test.
Several new versions of the population group question were qualitatively tested in 2023 to gauge acceptability among Canadians and to respond to requests from federal partners to use a similarly formatted question government-wide, allowing for more comparability. The wording of the question has been updated for testing in 2024, and modifications were made to the response categories to improve the accessibility of the question and encourage respondents to report belonging to multiple groups, if applicable. A new “First Nations, Métis or Inuk (Inuit)” response category has been added, and the logic of the questionnaire was changed to allow respondents to self-identify as belonging to Indigenous and non-Indigenous population groups, if applicable.
Religion will appear in the census test in the control version of the questionnaire, which is the 2021 census questionnaire. Note that the collection of data on religion in the census questionnaire is next planned for the 2031 Census of Population.
4.10 Indigenous Peoples
These questions allow for consistent and comprehensive counts of Indigenous people. These questions provide detailed information regarding First Nations people, Métis and Inuit to support the development and implementation of policies, programs and services for Canada and for First Nations, Métis and Inuit governments, individuals and organizations.
Statistics Canada also uses this information to sample respondents for the Indigenous Peoples Survey (IPS). The IPS is a national postcensal survey on the social and economic outcomes of First Nations people living off reserve, Métis and Inuit. The IPS informs policy and programming activities that are aimed at improving the well-being of Indigenous Peoples and the 2022 cycle covers topics such as education, health, language, access to services, economic well-being and cultural activities.
Questions on Registered or Treaty Indian status and membership in a First Nation or Indian band first appeared in the 1991 Census. A separate question on Indigenous identity first appeared in the 1996 Census. In earlier censuses, some information was collected on Indigenous Peoples: the 1911 Census had a question about “racial or tribal origin,” and the 1951 Census included a response category option for “Native Indian” in the ethnic origin question. In 2021, questions were added for Indigenous respondents to identify membership within a Métis organization or Settlement and enrollment under an Inuit land claims agreement.
Stakeholder discussion
Stakeholders shared that the census was the most fulsome source of information on Indigenous Peoples in Canada and is essential for evaluating the socioeconomic situations of First Nations, Métis and Inuit. This information was used by most stakeholders consulted and was identified as essential in fulfilling legislative requirements, evaluating and delivering programs and services, and research. No alternative data sources at the national level provide this information, as other surveys often exclude First Nations reserves and the North, and the small sample sizes restrict the analytical capacity of the data available.
Statistics Canada’s Centre for Indigenous Statistics and Partnerships ran parallel targeted engagement activities with Indigenous communities, organizations and stakeholders from across Canada. From November 2022 to March 2023, over 30 virtual and hybrid discussion sessions were held to obtain feedback on the census questions that are used to produce data about First Nations, Métis and Inuit populations. A summary of these discussions will be published in a separate report.
Qualitative testing
Minor changes to the Indigenous Peoples module were qualitatively tested in 2023 to improve understanding for respondents and acceptability in engagement with Indigenous leaders, organizations and community members. The language was updated to remove the term “Indian,” unless it is used as a legal term in reference to the Indian Act (i.e., “Registered Indian” or “Treaty Indian”). These changes will be tested quantitatively in the 2024 Census Test.
4.11 Mobility and second address
The mobility questions tell us where residents of Canada are moving to and from. This information is used to identify the characteristics of people who move and their needs in housing, education, health, transportation and social services.
Information about a person’s place of residence five years ago was first collected on the 1961 Census, and the question on place of residence one year ago was added to the 1991 Census.
Stakeholder discussion
The majority of stakeholders reported using mobility data for a variety of purposes, such as municipal planning, labour market analysis, service delivery and examination of the characteristics of areas where Canadians are moving to or from. This information was key for them in answering questions about when and why Canadians are moving to different parts of the country.
Stakeholders, particularly those from municipal governments, have requested data on Canadians who may have stayed at a second address for 30 days or more, particularly to identify how this affects service delivery and housing inventory and availability in areas where there may be a higher proportion of seasonal residents (e.g., cottage country, college towns, farming communities).
Qualitative testing
Changes to the question on place of residence one year ago were tested qualitatively in 2023 to improve the language congruence between French and English and to improve the understanding for French-speaking respondents.
Research was also done on potentially simplifying the question on place of residence five years ago, with exploration on supplementing or replacing it with administrative data to reduce respondent burden. This option has not yet proven to be adequate for replacing the question with administrative data in the quantitative test.
New questions were also tested qualitatively in 2023 to identify individuals who may have stayed at a second address for 30 days or more, whether consecutively or not (e.g., for vacation or leisure, school, work, to care for a family member, to receive medical care); the address where they stayed; and the amount of time spent per three-month period of that year.
As a result, for quantitative testing in 2024, modifications have been made to include new questions for people who live or stay at more than one address (e.g., students who live elsewhere while studying or children in joint custody) to better enumerate fluctuating populations, providing important information for municipal and urban planning, and to improve the measures of family dynamics and living arrangements.
4.12 Education
These questions collect information on the education, training and recent school attendance of residents of Canada, providing a snapshot of the educational credentials and qualifications of all Canadians, including those who studied outside Canada. Collecting these data on the census provides detailed information that can be analyzed by key demographic group, such as Indigenous Peoples and immigrants to Canada, and by detailed level of geography.
The 1871 Census collected information on school attendance. In 1941, a question was added about the highest grade of elementary or secondary schooling attained. More education questions were added in 1961 (e.g., the highest level of schooling; the highest certificate, diploma or degree; and the number of years of university schooling).
Stakeholder discussion
Education variables were used by some stakeholders to create a socioeconomic portrait of Canadians and to evaluate the educational profiles of smaller population groups, such as newcomers and other marginalized groups. These variables were also reported as key to creating community profiles and identifying what services and programs are effective or should be implemented. Governments use this information to develop training and other programs to meet the changing needs of the workforce and specific groups, such as immigrants, Indigenous Peoples and youth.
Qualitative testing
Small changes to the education questions were tested qualitatively in 2023 to clarify response options for respondents in English and French. These changes will be tested quantitatively in the 2024 Census Test.
Research was done simultaneously to evaluate the potential of using administrative tax data to replace the need to ask about college and university attendance during the reference year. This option has not yet proven to be adequate for replacing the question with administrative data for the quantitative test.
4.13 Labour market activities and commuting
Questions about labour market activity provide information on Canada’s workforce, including the industries and occupations people work in, the number of hours worked in a reference week, and people’s availability to start work. Including labour questions on the long-form questionnaire allows for the analysis of labour market activity according to individual and family characteristics, such as income, education, immigrant status and sociocultural factors. Employment information is used to assess the economic conditions of communities and specific populations, such as Indigenous Peoples and immigrants. Industry and occupation information is used to forecast job opportunities. Census data are used to update the National Occupational Classification system, which identifies and categorizes the entire range of occupational activity in Canada. Administrative files do not provide a complete picture of the labour market in all regions.
In 1871, the census collected information about a person’s occupation. A question on class of worker was added in 1891, and a question about the person’s industry was first asked in 1901. Questions about the usual hours worked each week and the weeks worked in the reference year were first asked in 1911. Starting in 1951, other labour questions were added (e.g., actual hours worked last week). In 2021, two questions were added to collect information on the main reason why some workers did not work the full year in 2020 and why some did not work full time in 2020. In 2021, a new question about multiple modes of transportation used to commute was added.
The commuting questions tell us where people work and how they get to work. This information is used to assess commuting patterns, public transit needs and energy use. Commuting information also helps to identify locations for new hospitals, schools, and daycare and recreational facilities, as well as the need for roads and other travel networks. The data are used by Statistics Canada as part of the criteria to define CMAs, census agglomerations (CAs), and CMA- and CA-influenced zones.
Stakeholder discussion
Labour market variables were used with other census variables by stakeholders for a variety of purposes to fulfill legislative requirements (e.g., under the Employment Equity Act) and to evaluate the social and economic conditions of small populations identified by the census. These data are used by stakeholders to identify trends in the labour market, define and analyze regional labour markets, and inform services and policies that address barriers to employment and labour legislation.
Transportation planners for provincial, territorial, regional and municipal governments use the commuting information to analyze traffic flows, assess transportation services, and plan for changes to these services and road networks.
Qualitative testing
Multiple changes to the labour market and commuting modules were tested qualitatively in 2023. In addition to reordering questions and updating response options, the logic of the questionnaire was changed to allow retired individuals to bypass most of the questions on labour market activities and commuting, thereby reducing the burden on a large portion of respondents.
Three new questions were tested qualitatively in the labour market activities module to identify those with professional certifications and whether their certifications are required for their current job.
Improvements were also made and tested in response to shifting labour force profiles and stakeholder requests to clarify questions for respondents who are hybrid, shift or gig workers.
Two additional questions were tested in the commuting module to identify which days of the week, or the number of times per week, people commute and the frequency of use of various methods (e.g., driving and using public transit on the same day, using different methods on different days) for those who commute using multiple modes of transportation.
Changes to the logic of the questionnaire were also tested to allow those who are absent or on lay-off to bypass up to three questions, thereby reducing the burden on a portion of respondents.
Additionally, some content was removed, further reducing the overall burden on a significant portion of respondents. The questions about the main reason people did not work the full year and the main reason people worked mostly part time were new to the 2021 questionnaire; however, they did not capture the expected results because of the effects of the COVID-19 pandemic on the labour market. It was also found that in 2021, the information provided by respondents in the “firm” write-in field was often repeated elsewhere in the industry or occupation write-in fields and was not supplying more detailed data. These three parts of the labour market activities section were removed from the questionnaire for qualitative testing in 2023 and will not be included in the 2024 Census Test questionnaire.
4.14 Income and expenses
The 1901 Census collected information on wages and salaries. In 1961, many income questions were added to the census (e.g., income in the previous year and benefits from employment insurance). However, since the 2016 Census, Statistics Canada has fully replaced the detailed income questions on the census questionnaire with administrative data. This change not only reduces collection costs and the burden on Canadians but also allows for more accurate information on income.
The census questionnaire has collected information on expenses related to child care and support payments since 2011. Along with the information collected from the Canada Revenue Agency on income, tax and benefits, these questions help provide more precise measures of disposable income for Canada’s official measure of poverty, the Market Basket Measure.
Stakeholder discussion
Stakeholders reported using income and expense information to examine the socioeconomic characteristics of Canadians. These data are used by provincial and federal governments and academics to inform research and policy on government income support programs, child care programs, and spousal support adjudication and compliance measures. Bill C-35, the Canada Early Learning and Child Care Act, has set March 2026 as the target for the implementation of the Canada-Wide Early Learning and Child Care program. Stakeholders have identified the need for additional data on unpaid child care to better understand the economic role of unpaid labour by members of the community such as grandparents who provide child care.
Qualitative testing
In response to stakeholder requests and emerging data needs, changes to the child care expenses question were tested qualitatively in 2023. These changes included restructuring the question to ask about the amount paid for child care per child younger than 12 years in the household and to identify any unpaid child care. The question used to ask whether the child was attending any care specifically arranged to facilitate one or both parents working at a paid job. To enhance its analytical and policy relevance in the early learning and child care domain, the scope of the question was changed to include child care for reasons beyond enabling parents or guardians to work and was tested qualitatively in 2023. These changes will be further tested quantitatively in the 2024 Census Test.
4.15 Housing and homelessness
Housing data serve to monitor key housing indicators, such as homeownership rates and housing affordability, which can shed light on the housing needs and concerns of Canadians. This information plays an important role in the development of government policies that affect the economy and the lives of Canadians. For example, policies at all levels of government, such as federal mortgage insurance policies, provincial and territorial affordable housing policies, and municipal zoning policies, help Canadians access safe, adequate and affordable housing.
These questions provide information used to develop housing communities and projects. Information on housing costs and the number of rooms and bedrooms in homes is used to assess crowding levels within dwellings and housing affordability. Such indicators are used by many organizations to help develop housing programs that support the housing needs of Canadians. Municipalities use information on the age of dwellings and the need for repairs to develop neighbourhood improvement programs.
Housing characteristics were first collected in the 1921 Census. In 2021, the collection of data on shelter costs was expanded to include all housing on reserves to respond to the emerging needs of households in all areas across Canada. The addition of the user and occupancy fees collected in band housing, complementing the concepts of rent and mortgage payments and property taxes for renters and owners, was done to help make nationwide housing affordability research possible.
Stakeholder discussions
Perceived data gaps broadly related to housing, housing status, dimensions of housing need, homelessness and dwelling characteristics were among the most frequently reported throughout the consultation.
Housing variables are key for stakeholders in fulfilling reporting requirements under the National Housing Strategy Act and ensuring the right to housing for Canadians. Stakeholders at all levels reported using housing variables to assess the availability, affordability and suitability of housing for a variety of geographies and population groups, and to inform policies, service delivery and legislation. Stakeholders also identified precarious housing and homelessness as a key data gap and barrier to providing more complete information on housing in Canada.
Qualitative testing
To respond to these emerging data needs, a new module on homelessness was qualitatively tested in 2023. A new set of questions was developed to capture Canadians’ experiences with homelessness and other housing challenges over the past 12 months and to identify people currently in precarious housing situations. The data collected will aim to help inform governments and organizations on the levels of homelessness and other housing challenges, including in rural and hard-to-reach communities. These data will help fulfill reporting requirements under the National Housing Strategy Act, which recognizes housing as a human right and commits the federal government to further the progressive realization of the right to adequate housing. These changes will be further tested quantitatively in the 2024 Census Test.
Additional questions were also tested in 2023 to identify precarious housing tenure, such as subletting, by asking about intra-household renting (e.g., a homeowner renting a room to another individual) and the type of subsidy received by a household. However, it was determined that they did not provide sufficient data as tested. Additionally, research was undertaken into the potential replacement of two housing concepts with administrative data: the dwelling period of construction and the farm operation indicator. The research deemed the replacement of the period of construction unfeasible at this time, while the replacement of the farm operation indicator will move forward for quantitative testing in 2024.
Next steps
The consultation described in this report assesses Canadians’ information needs for the 2026 Census of Population. Through this process, Statistics Canada found that most information needs are satisfied by existing census content, but changes could be made to further improve its relevance. Opportunities will be evaluated to minimize the burden of completing census questionnaires by replacing content with administrative data, as has been done in the past with income and immigration data. Statistics Canada has evaluated the data gaps reported by consultation respondents and is considering including some new content for the 2024 Census Test. However, not all gaps can be satisfied by the census; another data source may be a more suitable vehicle for some information.
Based on the content consultation results, Statistics Canada modified census questions and began testing the changes qualitatively during the summer 2023. The feedback from qualitative testing helped determine which questions will be further tested quantitatively with approximately 198,000 households during the 2024 Census Test.
The most notable changes for the 2024 Census Test include the following:
Household composition and marital status: Modifications have been made to the format of the household composition and marital status module to include new questions and changes to the response options and question wording to reduce respondent burden, use inclusive language, and better reflect changes in Canada’s social context.
General health: A new question on general health status has been added to the census test questionnaire to collect information on the health status of people in Canada.
Homelessness: A set of three new questions has been added to capture Canadians’ experiences with homelessness and other housing challenges over the past 12 months and to identify people currently in precarious housing situations.
Second address: A two-part question has been added to identify people who live or stay at more than one address, including children in joint custody or students who live elsewhere while studying, to improve measures of family dynamics and living arrangements and to better enumerate fluctuating populations.
Population group (visible minority): The wording of the question and the response categories have been modified to improve the accessibility of the question and to encourage respondents to report belonging to multiple groups, if applicable. A new “First Nations, Métis or Inuk (Inuit)” response category is now included. The logic of the questionnaire was also changed to allow respondents to self-identify as belonging to Indigenous and non-Indigenous population groups, if applicable.
Canadian military experience: The question on Canadian military experience was revised to be more inclusive of all branches, such as the COATS and the Canadian Rangers, and respondents will have additional options to select all types of service that apply and a write-in field to specify other details.
Labour market activities: The removal of three fields and changes to the logic of the questionnaire have been implemented to reduce the burden on a large portion of respondents, including retirees and those not working full time.
Commuting: A new question has been included to collect more detailed data about which days workers typically commute to better understand changes in commuting frequencies with the shift to hybrid or remote work.
Child care expenses: The question has been restructured to ask about the amount paid for child care per child younger than 12 years in the household and to identify any unpaid child care. The scope of the question now includes child care use for reasons beyond enabling parents or guardians to work.
The 2024 Census Test will allow Statistics Canada to statistically evaluate new and modified questions, as well as the collection procedures and tools to be used for the 2026 Census.
Determining the final content of the census questionnaire includes carefully examining and evaluating many criteria. Before submitting final recommendations for the 2026 Census, Statistics Canada must also assess the following important factors related to the Canadian context and its statistical programs:
- the ability to generate high-quality data
- the burden on Canadians
- privacy concerns
- the sensitivity of questions
- operational feasibility
- costs.
Following the results of the 2024 Census Test, Statistics Canada will submit recommendations to the Government of Canada regarding the content of the 2026 Census of Population. The government will determine final 2026 Census questionnaire content through an order in council, after which the content will be published in the Canada Gazette before being collected in the 2026 Census.
Appendix A – Content determination framework overview
In determining the content of the 2026 Census of Population questionnaire, Statistics Canada is employing the same framework used to determine the questionnaire content of the 2016 and 2021 censuses. The framework was developed from a review of Statistics Canada’s collection and processing methods following the 2011 Census. The findings of the review are presented in the Final Report on 2016 Census Options: Proposed Content Determination Framework and Methodology Options and in the 2016 Census Strategy Project: Data Uses and Requirements Report.
The content determination framework includes three main steps that help prioritize the Census of Population content. Each step comprises specific dimensions according to which potential content is evaluated. The steps and dimensions are summarized in Table A.1.
| Steps | Dimensions | |
|---|---|---|
| Step 1: Census data users’ needs (relevance and quality requirements) |
·Strength of census data users’ needs (e.g., legislative requirements, policy and program needs) ·Size of population of interest (e.g., small area or domain data needs) ·Suitability (and availability) of alternative sources ·Comparability over time |
|
| Step 2: Canadian context |
·Burden on Canadians ·Privacy concerns ·Sensitivity of questions or topics |
Balance of topics |
| Step 3: Statistics Canada’s operational considerations |
·Cost ·Ability to generate high-quality data ·Operational feasibility |
|
| Source: Statistics Canada, 2026 Census Content Consultation Guide, Table 1 (https://www12.statcan.gc.ca/census-recensement/2026/consultation/92-136-G/92-136-g2026001-eng.cfm). | ||
Appendix B – Distribution of responses to the 2026 online consultation
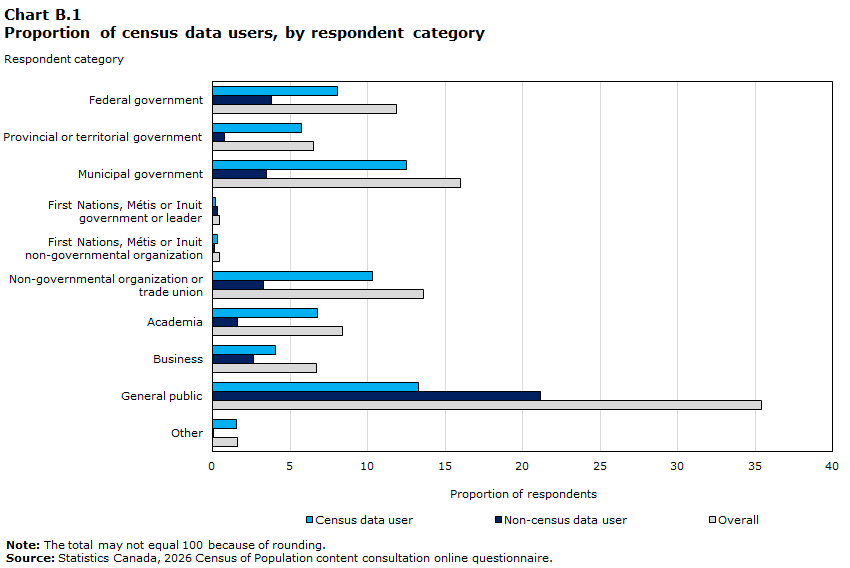
Data table for Chart B.1
| Respondent category | Census data user | Non-census data user | Overall |
|---|---|---|---|
| proportion of respondents | |||
| Federal government | 8.09 | 3.79 | 11.88 |
| Provincial or territorial government | 5.75 | 0.74 | 6.50 |
| Municipal government | 12.53 | 3.45 | 15.98 |
| First Nations, Métis or Inuit government or leader |
0.17 | 0.30 | 0.47 |
| First Nations, Métis or Inuit non-governmental organization |
0.30 | 0.14 | 0.44 |
| Non-governmental organization or trade union |
10.32 | 3.28 | 13.61 |
| Academia | 6.74 | 1.62 | 8.36 |
| Business | 4.03 | 2.67 | 6.70 |
| General public | 13.27 | 21.16 | 35.43 |
| Other | 1.56 | 0.07 | 1.62 |
|
Note: The total may not equal 100 because of rounding. Source: Statistics Canada, 2026 Census of Population content consultation online questionnaire. |
|||
| Respondent category | Total responses | Self-identified census data users | Overall response |
|---|---|---|---|
| number | percent | ||
| Federal government | 351 | 239 | 12 |
| Provincial or territorial government | 192 | 170 | 6 |
| Municipal government | 472 | 370 | 16 |
| First Nations, Métis or Inuit government or leader | 14 | 5 | 0 |
| First Nations, Métis or Inuit non-governmental organization | 13 | 9 | 0 |
| Non-governmental organization or trade union | 402 | 305 | 14 |
| Academia | 247 | 199 | 8 |
| Business | 198 | 119 | 7 |
| General public | 1,017 | 392 | 34 |
| Other | 48 | 46 | 2 |
| Unspecified | 1 | 0 | 0 |
| Total | 2,955 | 1,854 | 100 |
| Source: Statistics Canada, 2026 Census of Population content consultation online questionnaire. | |||
| Province or territory | Total responses |
|---|---|
| Newfoundland and Labrador | 98 |
| Prince Edward Island | 34 |
| Nova Scotia | 94 |
| New Brunswick | 91 |
| Quebec | 637 |
| Ontario | 1,125 |
| Manitoba | 122 |
| Saskatchewan | 130 |
| Alberta | 284 |
| British Columbia | 305 |
| Yukon | 13 |
| Northwest Territories | 10 |
| Nunavut | 6 |
| Unspecified | 6 |
| Grand Total | 2,955 |
| Source: Statistics Canada, 2026 Census of Population content consultation online questionnaire. | |
Appendix C – Small geographies and populations of interest
| Respondent category | National, provincial or territorial | Census metropolitan area or census agglomeration | Census division | Census subdivision | Aggregate dissemination area | Census tract | Dissemination area | Dissemination block or block face | Other | Total | |
|---|---|---|---|---|---|---|---|---|---|---|---|
| percentage of respondents | percent | number | |||||||||
| Federal government | 29 | 19 | 3 | 22 | 3 | 5 | 4 | 8 | 7 | 100 | 240 |
| Provincial or territorial government | 17 | 9 | 5 | 20 | 3 | 5 | 22 | 11 | 8 | 100 | 170 |
| Municipal government | 16 | 8 | 9 | 14 | 1 | 9 | 15 | 17 | 10 | 100 | 369 |
| First Nations, Métis or Inuit government or leader | 20 | 0 | 0 | 40 | 0 | 0 | 0 | 20 | 20 | 100 | 5 |
| First Nations, Métis or Inuit non-governmental organization | 44 | 0 | 11 | 11 | 11 | 11 | 0 | 0 | 11 | 100 | 9 |
| Non-governmental organization or trade union | 26 | 24 | 7 | 15 | 2 | 7 | 7 | 5 | 7 | 100 | 305 |
| Academia | 13 | 19 | 9 | 20 | 1 | 9 | 15 | 9 | 7 | 100 | 199 |
| Business | 10 | 17 | 6 | 18 | 3 | 8 | 23 | 8 | 8 | 100 | 119 |
| General public | 14 | 18 | 6 | 26 | 2 | 10 | 6 | 8 | 10 | 100 | 393 |
| Other | 4 | 4 | 9 | 30 | 0 | 7 | 2 | 11 | 33 | 100 | 46 |
| Overall | 18 | 16 | 7 | 20 | 2 | 8 | 11 | 10 | 9 | 100 | 1,855 |
|
Note: The total may not equal 100 because of rounding. Source: Statistics Canada, 2026 Census of Population content consultation online questionnaire. |
|||||||||||
| Respondent category | Total Canadian population | Indigenous Peoples | Ethnic or cultural groups | Religious groups | Language groups | Population groups (visible minorities)Table C.2 Population groups of interest to respondents Note 1 |
Immigrants or newcomers | Seniors | Children or youth | Students | Low income households | Other (all) | Total data users |
|---|---|---|---|---|---|---|---|---|---|---|---|---|---|
| percentage of respondents who reported the group is of interest | number | ||||||||||||
| Federal government | 84 | 73 | 54 | 20 | 49 | 60 | 55 | 44 | 41 | 35 | 45 | 28 | 239 |
| Provincial or territorial government | 71 | 56 | 49 | 18 | 50 | 49 | 61 | 51 | 58 | 44 | 51 | 32 | 170 |
| Municipal government | 58 | 38 | 37 | 22 | 42 | 35 | 53 | 67 | 72 | 51 | 62 | 24 | 370 |
| First Nations, Métis or Inuit government or leader | 20 | 60 | 0 | 0 | 40 | 20 | 20 | 60 | 40 | 40 | 40 | 0 | 5 |
| First Nations, Métis or Inuit non-governmental organization | 67 | 78 | 11 | 11 | 33 | 11 | 11 | 44 | 67 | 22 | 33 | 11 | 9 |
| Non-governmental organization or trade union | 57 | 40 | 44 | 13 | 39 | 49 | 58 | 50 | 46 | 34 | 50 | 38 | 305 |
| Academia | 82 | 52 | 54 | 29 | 43 | 53 | 61 | 44 | 45 | 42 | 52 | 27 | 199 |
| Business | 81 | 49 | 47 | 24 | 50 | 39 | 57 | 56 | 50 | 41 | 47 | 35 | 119 |
| General public | 64 | 22 | 31 | 20 | 28 | 25 | 36 | 30 | 26 | 18 | 22 | 35 | 392 |
| Other | 54 | 30 | 50 | 39 | 24 | 15 | 46 | 22 | 26 | 15 | 9 | 46 | 46 |
| Overall | 68 | 43 | 43 | 21 | 40 | 41 | 52 | 48 | 47 | 36 | 45 | 31 | 1,854 |
|
|||||||||||||
Appendix D – Purposes of using census data
| Respondent category | Total respondents | Statutory or regulatory | Resource allocation for programs and policies | Service delivery for programs | Planning, development, monitoring, evaluation and performance reports related to programs and policies | Research | Other purpose (all) | ||||||
|---|---|---|---|---|---|---|---|---|---|---|---|---|---|
| number | number | percent | number | percent | number | percent | number | percent | number | percent | number | percent | |
| Federal government | 239 | 33 | 14 | 114 | 48 | 121 | 51 | 176 | 74 | 167 | 70 | 33 | 14 |
| Provincial or territorial government | 170 | 29 | 17 | 84 | 49 | 92 | 54 | 141 | 83 | 118 | 69 | 25 | 15 |
| Municipal government | 370 | 70 | 19 | 235 | 64 | 272 | 74 | 327 | 88 | 185 | 50 | 57 | 15 |
| First Nations, Métis or Inuit government or leader | 5 | 1 | 20 | 3 | 60 | 5 | 100 | 5 | 100 | 3 | 60 | 0 | 0 |
| First Nations, Métis or Inuit non-governmental organization | 9 | 2 | 22 | 6 | 67 | 6 | 67 | 6 | 67 | 8 | 89 | 1 | 11 |
| Non-governmental organization or trade union | 305 | 47 | 15 | 156 | 51 | 196 | 64 | 237 | 78 | 222 | 73 | 56 | 18 |
| Academia | 199 | 5 | 3 | 45 | 23 | 51 | 26 | 82 | 41 | 189 | 95 | 19 | 10 |
| Business | 119 | 8 | 7 | 28 | 24 | 39 | 33 | 76 | 64 | 93 | 78 | 25 | 21 |
| General public | 392 | 20 | 5 | 89 | 23 | 88 | 22 | 119 | 30 | 304 | 78 | 131 | 33 |
| Other | 46 | 0 | 0 | 0 | 0 | 2 | 4 | 1 | 2 | 41 | 89 | 16 | 35 |
| Total | 1,854 | 215 | 12 | 760 | 41 | 872 | 47 | 1,170 | 63 | 1,330 | 72 | 363 | 20 |
| Source: Statistics Canada, 2026 Census of Population content consultation online questionnaire. | |||||||||||||
Appendix E – Perceived data gaps in census content
| Data gap theme | Federal government | Provincial or territorial government | Municipal government | IndigenousTable E.1 Frequency of perceived data gaps reported during consultation, by respondent category Note 1 |
Non-governmental organization or trade union | Academia | Business | General public and otherTable E.1 Frequency of perceived data gaps reported during consultation, by respondent category Note 2 |
Reported frequency | |
|---|---|---|---|---|---|---|---|---|---|---|
| number | number | percent | ||||||||
| Geography | 6 | 9 | 25 | 0 | 14 | 8 | 8 | 13 | 83 | 4 |
| Demography, age, names, seniors and youth | 1 | 4 | 8 | 0 | 7 | 4 | 1 | 19 | 44 | 2 |
| Sex at birth, gender and sexual orientation | 42 | 12 | 12 | 2 | 29 | 28 | 8 | 48 | 181 | 8 |
| Household composition, families and relationships | 4 | 13 | 2 | 0 | 24 | 7 | 5 | 48 | 103 | 4 |
| Languages | 5 | 3 | 12 | 0 | 20 | 7 | 1 | 21 | 69 | 3 |
| Canadian military experience | 11 | 0 | 0 | 0 | 0 | 1 | 0 | 2 | 14 | 1 |
| Language of instruction | 2 | 10 | 19 | 0 | 23 | 2 | 4 | 12 | 72 | 3 |
| Place of birth, immigration and citizenship | 6 | 3 | 4 | 0 | 12 | 6 | 6 | 33 | 70 | 3 |
| Ethnic or cultural origins | 0 | 2 | 3 | 0 | 4 | 1 | 3 | 23 | 33 | 1 |
| Visible minority (population group)Table E.1 Frequency of perceived data gaps reported during consultation, by respondent category Note 3 |
12 | 7 | 4 | 0 | 13 | 3 | 4 | 22 | 65 | 3 |
| Indigenous Peoples | 18 | 3 | 4 | 2 | 10 | 5 | 5 | 18 | 65 | 3 |
| Religion | 1 | 0 | 4 | 0 | 6 | 10 | 3 | 11 | 35 | 2 |
| Mobility | 2 | 1 | 6 | 0 | 2 | 5 | 1 | 2 | 19 | 1 |
| Education | 3 | 3 | 4 | 0 | 4 | 11 | 0 | 12 | 37 | 2 |
| Labour marker activities | 17 | 24 | 11 | 0 | 18 | 14 | 7 | 40 | 131 | 6 |
| Place of work, journey to work and work from home | 9 | 5 | 11 | 2 | 3 | 4 | 7 | 8 | 49 | 2 |
| Income, assets, wealth, work for pay and taxes | 10 | 11 | 14 | 0 | 8 | 8 | 9 | 43 | 103 | 4 |
| Expenditures, payments, monthly bills and cost of services | 7 | 15 | 7 | 0 | 23 | 8 | 17 | 13 | 90 | 4 |
| Housing, housing status, dimensions of housing need, homelessness and dwelling characteristics | 32 | 15 | 25 | 2 | 38 | 26 | 19 | 40 | 197 | 9 |
| Disability, health, mental health, activities of daily living and well-being | 31 | 15 | 17 | 0 | 135 | 40 | 19 | 104 | 361 | 16 |
| Transportation modes, movements and travel | 2 | 4 | 20 | 0 | 6 | 22 | 1 | 12 | 67 | 3 |
| Unpaid work, caregiving and volunteering | 0 | 2 | 1 | 0 | 19 | 9 | 1 | 10 | 42 | 2 |
| Collective dwellings | 1 | 2 | 1 | 0 | 3 | 2 | 4 | 7 | 20 | 1 |
| Internet access and digital skills | 6 | 0 | 4 | 0 | 5 | 8 | 5 | 6 | 34 | 1 |
| Coverage, secondary residences, and who and where to include | 2 | 4 | 9 | 0 | 10 | 6 | 1 | 7 | 39 | 2 |
| Census methodology, field operations or formats, and dissemination | 13 | 6 | 13 | 0 | 16 | 8 | 10 | 30 | 96 | 4 |
| Crime, justice and death | 2 | 3 | 1 | 0 | 9 | 5 | 2 | 17 | 39 | 2 |
| Economic and industrial | 3 | 1 | 2 | 0 | 6 | 7 | 3 | 6 | 28 | 1 |
| Opinion and politics | 1 | 0 | 1 | 0 | 2 | 0 | 2 | 19 | 25 | 1 |
| Climate and environmental | 2 | 0 | 1 | 0 | 3 | 2 | 5 | 2 | 15 | 1 |
| Leisure, hobbies, perceptions of life, sociospacial contributors to quality of life and satisfaction, and access to public supports and services | 3 | 7 | 5 | 0 | 13 | 10 | 9 | 10 | 57 | 2 |
| Not applicable | 2 | 0 | 0 | 0 | 0 | 3 | 0 | 2 | 7 | 0 |
| Total | 256 | 184 | 250 | 8 | 485 | 280 | 170 | 657 | 2,290 | 100 |
|
||||||||||
Appendix F – 2021 Census of Population questions by topic
The following are the 2021 Census of Population topics and related question themes.
For the detailed questions, consult the 2021 Census of Population questionnaires.
Demography
- Sex at birth
- Gender
- Date of birth, age
- Legal marital status
- Common-law status
Household composition
- Relationship to other people in the household
Languages
- Knowledge of official languages
- Knowledge of non-official languages
- Languages spoken regularly at home
- Languages spoken most often at home
- First languages learned at home in childhood and still understood
- Languages used regularly at work
- Languages used most often at work
Canadian military experience
- Canadian military experience
Language of instruction
- Primary or secondary schooling in an English-language school in Canada
- Primary or secondary schooling in a French immersion program in an English-language school in Canada
- Primary or secondary schooling in a regular French program in a French-language school in Canada
Activities of daily living
- Difficulties seeing
- Difficulties hearing
- Difficulties walking, using stairs, using hands or fingers, or doing other physical activities
- Difficulties learning, remembering or concentrating
- Emotional, psychological or mental health conditions
- Other health problem or long-term condition that has lasted or is expected to last for six months or more
Place of birth, citizenship and immigration
- Place of birth
- Place of birth of parents
- Canadian citizenship (by birth or naturalization)
- Other countries of citizenship
- Immigration (from linked data)
Ethnic or cultural origins
- Ethnic or cultural origins
Population groups (visible minorities)
- Population groups (visible minorities)
Indigenous Peoples
- Indigenous group
- Registered or Treaty Indian status
- Membership in a First Nation or Indian band
- Membership in a Métis organization or Settlement
- Enrolment under an Inuit land claims agreement
Religion
- Religion
Mobility
- Place of residence one year ago
- Place of residence five years ago
Education
- High school (secondary school) diploma or equivalent
- Registered apprenticeship or other trades certificate or diploma
- College, CEGEP, or other non-university certificate or diploma
- University certificate, diploma or degree
- Major field of study of highest certificate, diploma or degree
- Province, territory or country where highest certificate, diploma or degree was completed
- Recent school attendance
- Type of school attended
Labour market activities
- Hours worked for pay or in self-employment
- On temporary lay-off or absent from job or business
- New job to start within four weeks of reference week
- Looked for paid work in the four weeks prior to reference date
- Reasons unable to start a job
- When last worked for pay or in self-employment
- Main job—name of employer
- Main job—kind of business, industry or service
- Main job—work or occupation
- Main job—main activities at work
- Main job—class of worker
- Self-employed—incorporation status of business or farm
- Number of weeks worked for pay or self-employment
- Main reason why person did not work for the whole year
- Full-time or part-time paid work
- Main reason why person worked mostly part time instead of full time
Place of work and commuting to work
- Place of work
- Modes of transportation usually used to get to work
- Main mode of commuting to work
- Number of persons sharing ride to work
- Time person usually leaves home to go to work
- Usual number of minutes to get from home to work
Income and expenses
- Amount paid for child care
- Amount paid for child or spousal support payments
- Income (from linked data)
Housing
- Dwelling—who pays the rent or mortgage, taxes, electricity, etc. for this dwelling
- Dwelling—owned or rented, including band housing
- Dwelling—part of a condominium development
- Dwelling—number of rooms
- Dwelling—number of bedrooms
- Dwelling—period when dwelling was built
- Dwelling—need of repairs
- Dwelling—located on an agricultural operation
- Dwelling—yearly payments for electricity
- Dwelling—yearly payments for oil, gas, coal, wood or other fuels
- Dwelling—yearly payments for water and other municipal services
- Renter—monthly rent
- Renter—subsidized dwelling
- Owner—monthly mortgage or loan payments
- Owner—property taxes (municipal and school), including estimated yearly property taxes and as part of monthly mortgage or loan payments
- Owner—estimated value of dwelling if to sell
- Owner—monthly condominium fees
- Dwelling provided by the local government, First Nation or Indian band, monthly payment paid to use or occupy this dwelling
- Date modified: