
A portrait of educational attainment and occupational outcomes among racialized populations in 2021
Skip to text
Text begins
Start of text box 1
Highlights
- The 2021 Census shows the diversity in educational characteristics between, and within, racialized groups in Canada.
- Many Asian populations had levels of educational attainment well above the national average. Over half of Korean, Chinese, South Asian and West Asian people and more than 40% of the Japanese and Arab populations achieved a bachelor’s degree or higher, compared with the national average of 32.9%. As a result, these populations were highly represented in many occupations requiring a bachelor’s degree.
- Over 40% of Filipino people also had a bachelor’s degree or higher, but they were underrepresented in occupations requiring a bachelor’s degree. This group was particularly likely to study registered nursing.
- Southeast Asian people had lower levels of education: more than one-fifth (21.7%) had neither a high school diploma nor a postsecondary credential—larger than the share for any other racialized group—because many arrived as refugees in 1979 and the 1980s.
- The educational attainment of Black populations varied greatly; for example, 46.3% of Black children of African immigrants had a bachelor’s degree or higher, compared with 15.8% of Black children of Canadian-born parents.
End of text box 1
Introduction
The proportion of the Canadian population with a bachelor’s degree or higher is increasing, and this is particularly significant given the current high levels of labour demand for educated workers. However, this population of degree holders is highly diverse, and the overall picture may not reflect the experience of all groups, including racialized groups. This article examines two key questions focusing on different racialized groups. First, to what degree does educational attainment differ between and within racialized groups? Second, are racialized populations finding jobs that correspond to their education? Through this analysis, the varying socioeconomic outcomes of racialized people are more clearly illuminated.
Overall, racialized groups in Canada tend to be highly educated. The Census of Population is a rich source of data that collects detailed information for 10 racialized groups: South Asian, Chinese, Black, Filipino, Latin American, Arab, Southeast Asian, West Asian, Korean and Japanese people.Note 1 Data from the 2021 Census show that while racialized groups made up over one-quarter (27.3%) of the population aged 25 to 64, they made up nearly 40% of people in that age group with a bachelor’s degree or higher. However, such generalizations mask large differences; certain racialized groups, or specific populations within these groups, face barriers in access to education and have below-average educational attainment.
Both educational attainment and the connections between education and the labour market differ not only between racialized groups, but within these groups based on characteristics such as immigrant status, generation status, country of birth and location of study.
Immigrant status and generation status are particularly relevant characteristics when understanding factors impacting racialized groups. Among every racialized group except the Japanese population, over 75% of the working-age population (aged 25 to 64) were in the first generation (born outside Canada; mainly immigrants and non-permanent residents). Most of the remainder were in the second generation—born in Canada, with a least one parent born outside Canada. The Japanese (31.7%) and Black (5.0%) populations were the only racialized groups where over 2% of the working-age population were in the third generation or more (born in Canada to Canadian-born parents).
Immigrants tend to be highly educated because education is part of the selection criteria of Canada’s immigration system. Second-generation populations also typically have above-average educational attainment; contributing factors include the high educational attainment of their parents and the high expectations for their educational attainment held by both their parents and the individuals themselves.Note 2 At the same time, immigrants with foreign degrees face above-average rates of overqualification (i.e., having a bachelor’s degree or higher but working in a job that typically requires a high school education at most),Note 3 and this is particularly the case among racialized people despite their high levels of education.Note 4 Even among those with Canadian credentials, some racialized individuals still face higher overqualification rates.
Above-average educational attainment among many Asian populations
Many Asian populations attained a bachelor’s degree or higher at rates that were well above the national average of 32.9%. Over half of the Korean, Chinese, South Asian and West Asian populations and over 40% of the Arab, Japanese and Filipino populations had a bachelor’s degree or higher (Chart 1).
In most cases, this high educational attainment was consistent across genders and generations. Among each of these seven groups, the share with a bachelor’s degree or higher was over 40% among both first- and second-generation women and men, except for first-generation (39.8%) and second-generation (29.9%) Filipino men. It was also over 40% among the third-generation-or-more Japanese and Chinese populations, though it was lower among third-generation-or-more South Asian people (26.3%).Note 5

Data table for Chart 1
| No certificate, diploma or degree | High school diploma or equivalency certificate | Postsecondary certificate or diploma below bachelor level | Bachelor's degree or higher | |
|---|---|---|---|---|
| percent | ||||
| Korean | 1.4 | 15.7 | 22.5 | 60.5 |
| Chinese | 7.5 | 16.0 | 20.1 | 56.3 |
| South Asian | 8.5 | 18.2 | 18.1 | 55.2 |
| West Asian | 10.7 | 17.3 | 19.1 | 52.9 |
| Arab | 12.2 | 14.5 | 24.8 | 48.5 |
| Japanese | 2.1 | 18.5 | 31.2 | 48.2 |
| Filipino | 2.7 | 21.0 | 30.9 | 45.5 |
| Multiple racialized groups | 9.4 | 18.4 | 27.0 | 45.3 |
| Latin American | 11.0 | 21.3 | 30.6 | 37.1 |
| Total population | 9.9 | 23.0 | 34.3 | 32.9 |
| Black | 10.4 | 21.9 | 35.3 | 32.4 |
| Southeast Asian | 21.7 | 23.4 | 24.5 | 30.5 |
| Racialized group, n.i.e. | 13.4 | 26.0 | 32.5 | 28.1 |
|
Note: In this chart, the concept of "racialized group" is derived directly from the concept of "visible minority." The Employment Equity Act defines visible minorities as "persons, other than Aboriginal peoples, who are non-Caucasian in race or non-white in colour." The abbreviation "n.i.e." means "not included elsewhere." This category includes people who provided written responses such as "Guyanese," "Pacific Islander," "Polynesian," "Tibetan" or "West Indian." Source: Statistics Canada, Census of Population, 2021. |
||||
Many Asian populations have well above-average representation in professional occupations
Consistent with their high levels of education, the South Asian, Chinese, Arab, West Asian, Korean and JapaneseNote 6 populations each made up a larger share of working-age people in professional occupations (that is, occupations typically requiring a bachelor’s degree or higher)Note 7 than they did of the overall working-age population (Chart 2).

Data table for Chart 2
| Share of working-age population | Share of all professional occupations | Share of engineers | Share of computing professionals | Share of doctors | Share of secondary, elementary and kindergarten school teachers | |
|---|---|---|---|---|---|---|
| percent | ||||||
| South Asian | 7.3 | 8.9 | 12.4 | 19.0 | 12.5 | 3.6 |
| Chinese | 5.0 | 7.0 | 10.2 | 12.0 | 8.0 | 2.1 |
| Black | 4.0 | 3.7 | 3.0 | 3.5 | 2.9 | 2.4 |
| Filipino | 2.9 | 1.8 | 1.9 | 1.7 | 0.6 | 0.7 |
| Arab | 1.9 | 2.1 | 3.8 | 2.5 | 5.1 | 1.3 |
| Latin American | 1.9 | 1.6 | 2.6 | 2.4 | 1.0 | 0.7 |
| Southeast Asian | 1.2 | 0.9 | 1.2 | 1.5 | 1.1 | 0.3 |
| West Asian | 1.1 | 1.4 | 3.6 | 1.7 | 2.0 | 0.4 |
| Korean | 0.7 | 0.8 | 0.8 | 1.0 | 1.0 | 0.4 |
| Japanese | 0.3 | 0.3 | 0.3 | 0.3 | 0.4 | 0.3 |
| Racialized group, n.i.e. | 0.5 | 0.4 | 0.4 | 0.5 | 0.4 | 0.3 |
| Multiple racialized groups | 0.7 | 0.9 | 0.9 | 1.1 | 0.9 | 0.5 |
|
Notes: ‘Professional occupations’ refers to occupations typically requiring a bachelor’s degree or higher (TEER 1 in the NOC 2021). In this chart, the concept of "racialized group" is derived directly from the concept of "visible minority." The Employment Equity Act defines visible minorities as "persons, other than Aboriginal peoples, who are non-Caucasian in race or non-white in colour." The abbreviation "n.i.e." means "not included elsewhere." This category includes people who provided written responses such as "Guyanese," "Pacific Islander," "Polynesian," "Tibetan" or "West Indian." Source: Statistics Canada, Census of Population, 2021. |
||||||
In some occupations, representation was particularly high for certain racialized groups. For example, South Asian and Chinese people were highly represented among engineers,Note 8 computing professionalsNote 9 and doctors, as were Arab and West Asian people among engineers and doctors.
In contrast, Korean people were highly represented among religious leaders and in the performing arts: they made up 0.7% of the working-age population but 5.1% of religious leaders and 2.1% of conductors, composers, arrangers, musicians and singers. The Japanese population was likewise highly represented in the performing arts, making up 0.9% of conductors, composers, arrangers, musicians and singers, whereas they made up 0.3% of the working-age population.
One notable exception to this pattern of high representation in professional occupations was that every racialized group except Japanese people was underrepresented among secondary, elementary and kindergarten teachers.
Filipino people with a bachelor’s degree or higher from outside Canada have higher levels of overqualification
Despite having similarly high levels of education to many other Asian groups, Filipino people were underrepresented in occupations requiring a bachelor’s degree or higher (see Chart 2) to a greater extent than any other racialized group.Note 10 Two main factors played into this. First, Filipino people with a bachelor’s degree or higher were more likely to have studied outside Canada (82.5%)Note 11 than other racialized groups (under 70% in all cases). Second, 41.8% of Filipino people with foreign degrees were overqualified, more than 10 percentage points higher than foreign-educated individuals of any other racialized group.
Immigrants from the Philippines have specific difficulties obtaining degree recognition.Note 12 Their overqualification rate was high despite registered nursing,Note 13 a highly in-demand field, being the field of study for over one-fifth (21.4%) of Filipino women with a foreign degree and over one-tenth (11.0%) of Filipino men with a foreign degree.
One factor in overqualification and job mismatch was that over one-third (34.0%) of Filipino immigrant women immigrated as principal applicants through the caregiver program,Note 14 which recruits them to work in personal care occupations. Nearly half of Filipino women with foreign registered nursing degrees who immigrated as caregivers worked as nurse aides, orderlies or patient service associates (35.8%) or in sales and service occupations (12.6%). About one-fifth (20.3%) worked as registered nurses, compared with about two-fifths (39.6%) of Filipino women with foreign registered nursing degrees who entered through other economic programs.Note 15
Prior research examined the relationship between the persistent overqualification of care workers and their admission to Canada through the caregiver program. These studies found that after years of working as caregivers to gain permanent residency, women who entered through the program typically remained in these jobs even after they became permanent residents, rather than gaining jobs more closely related to their degree.Note 16
The program can also require long separations for women from their spouses and children in the Philippines as the women work to gain permanent residency first for themselves and then for their families.Note 17 This places stress on families and may affect their children’s future education. Among Filipino people aged 20 to 24 who were in the first generation and immigrated to Canada before the age of 15, 18.9% of children of caregiver parents attended university in the 2020/2021 school year, compared with 36.4% of those whose parents immigrated through other programs.Note 18 As of 2019, changes to the caregiver program allow non-permanent residents in the program to gain entry for their spouse and children via work and study permits.
Southeast Asian people and South Asian people born in Sri Lanka achieve major jumps in education between refugee parents and second-generation children
In contrast to the high educational attainment of other Asian groups, the Southeast Asian population was more likely than any other group to have no certificate, diploma or degree (21.7%). This was because over half (54.3%) of Southeast Asian people aged 25 to 64 had arrived in Canada as refugees or family class immigrants—in large part during and after the high number of Vietnamese arrivals from 1979 to 1980Note 19—rather than as economic immigrants.Note 20
However, the proportion of second-generation Southeast Asian people with no certificate, diploma or degree was much lower (5.5%) and the proportion with a bachelor’s degree or higher was much higher (43.6%) than for the Southeast Asian population as a whole, showing that this generation built upon the achievements of their parents.Note 21
A similar pattern was seen among South Asians born in Sri Lanka. Approximately three-quarters (74.3%) were refugees or family class immigrants, and they were much less likely to have a bachelor’s degree or higher (25.0%) than South Asians born in India, Pakistan or Bangladesh (all between 59% and 64%). However, 63.7% of the children of these immigrants from Sri Lanka had a bachelor’s degree or higher, more than the share among the children of South Asian immigrants from India, Pakistan or Bangladesh (ranging from approximately 57% to 61%).Note 22
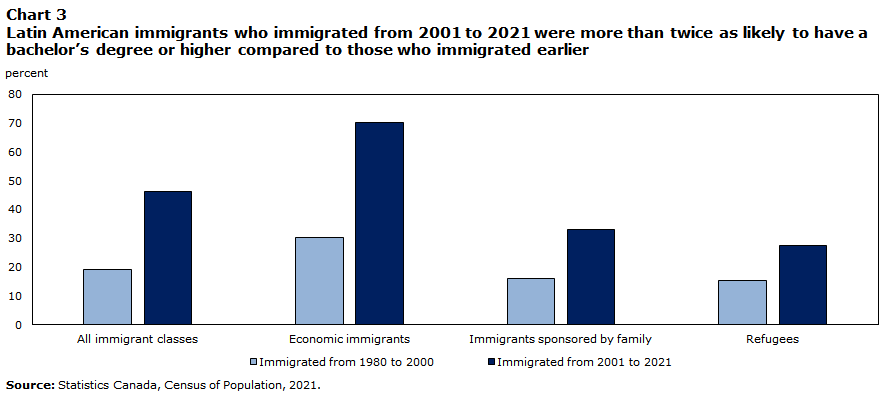
Much higher educational attainment among Latin American immigrants in the 21st century than among those who arrived in earlier years
Relative to other racialized groups, the educational attainment of the Latin American and Black populations was closer to the averages for the total population. The share with a bachelor’s degree or higher was 37.1% among Latin American people and 32.4% among the Black population, compared with the national average of 32.9%. In all the above cases, this was higher than the average for Southeast Asian people (30.5%) and lower than the averages for the other seven racialized groups.
However, this apparent similarity masks large variations within both the Latin American and the Black populations. In the case of the Latin American population, the variations are particularly connected to period of immigration and generation status. Less than one-fifth (19.1%) of Latin American people who immigrated before 2001 had a bachelor’s degree or higher. Among the second-generation Latin American population (whose parents would have immigrated before 2001Note 23), the share with a bachelor’s degree or higher was greater, at 24.4%.
Latin American people who immigrated in 2001 or later were much more highly educated than either earlier immigrants or the second-generation population; 46.2% had a bachelor’s degree or higher. This difference existed across all immigrant classes (Chart 3). Places of birth also differed between the two groups of immigrants: 44.3% of Latin American people who immigrated before 2001 were from Central America, especially El Salvador (24.8%), while close to half of those who immigrated in 2001 or later were from either Colombia (26.9%) or Mexico (22.0%).
Data table for Chart 3
| Immigrated from 1980 to 2000 | Immigrated from 2001 to 2021 | |
|---|---|---|
| percent | ||
| All immigrant classes | 19.1 | 46.2 |
| Economic immigrants | 30.2 | 70.2 |
| Immigrants sponsored by family | 16.2 | 33.2 |
| Refugees | 15.2 | 27.5 |
| Source: Statistics Canada, Census of Population, 2021. | ||
The Black population with African origins have well above-average educational attainment, while Black people with Canadian-born parents face education gaps
The overall share of the Black population with a bachelor’s degree or higher (32.4%) was similar to the national average (32.9%), as noted above. However, as with the Latin American population, this figure conceals large variations within the population group.
The Black population in Canada is largely made up of Caribbean immigrantsNote 24 (particularly from Jamaica and Haiti) and their children, African immigrants and their children, and Black people with Canadian-born parents. The third group includes descendants of Black populations that may have existed in Canada for centuries and the grandchildren of Caribbean immigrants. These groups had major differences in educational attainment (Chart 4).

Data table for Chart 4
| Percent | |
|---|---|
| Total Black population | 32.4 |
| First generation | |
| Born in Africa | 42.2 |
| Born in Caribbean | 19.4 |
| Second generation | |
| At least one parent born in Africa | 46.3 |
| At least one parent born in Caribbean | 28.5 |
| Third generation or more | 15.8 |
| Source: Statistics Canada, Census of Population, 2021. | |
Among the Black population, attainment of a bachelor’s degree or higher was greatest, at over 40%, among those born in Africa and among their children. It was lower for those born in the Caribbean (19.4%), but the share among their children (28.5%) was higher and closer to the average for the total population (32.9%). Immigration from the Caribbean in substantial numbers largely began in the late 1960s, whereas most Black immigration from Africa has happened in the last few decades, when educational requirements for economic immigrants have been very high.
The share of the third-generation-or-more Black population with a bachelor’s degree or higher was notably lower than that of the other two groups, at 15.8%. Over half (50.2%) of this group had no postsecondary credentials.
The Black population also faced the challenge of overqualification. In contrast to most other racialized groups, this was not mainly associated with foreign credential recognition: 16.0% of Black workers with a bachelor’s degree or higher from a Canadian institution worked in occupations that required a high school diploma or less. This was the highest overqualification rate of any Canadian-educated racialized group; the next highest was South Asian people, at 14.2%, and the average for the Canadian-educated population was 11.1%. Moreover, the rate was similar across first-generation (15.8%), second-generation (16.6%) and third-generation-or-more (15.7%) Black populations. This is consistent with other data relating to challenges faced by Black workers; they were more likely than other workers to report facing discrimination or unfair treatment in the workplace.Note 25
Looking ahead
An article focusing on the diverse education and labour market experiences of different Black populations will be released in the coming months. Using 2021 Census of Population data, the article will analyze, in more detail, the education and earnings of the three main groups within the Canadian-born Black population. In addition, more data tables on the education and labour market outcomes of racialized populations will be released for more detailed geographical areas, such as municipalities.
Data sources, methods and definitions
Data sources
The data in this analysis are from the 2021 Census of Population. Further information on the census can be found in the Guide to the Census of Population, 2021, Catalogue no. 98-304-X2021001.
All information on the quality and comparability of census data on education can be found in the Education Reference Guide, Census of Population, 2021, Catalogue no. 98-500-X2021013.
Methods
The universe for this study included the population aged 25 to 64 in private households.
Random rounding and percentage distributions: To ensure the confidentiality of responses collected for the 2021 Census, a random rounding process is used to alter the values reported in individual cells. As a result, when these data are summed or grouped, the total value may not match the sum of the individual values, since the total and subtotals are independently rounded. Similarly, percentage distributions, which are calculated on rounded data, may not add up to 100%.
Definitions
Racialized group: The concept of “racialized group” is derived directly from the detailed “visible minority” variable in the census. The term “visible minority” comes from the Employment Equity Act. The act defines visible minorities as “persons, other than Aboriginal peoples, who are non-Caucasian in race or non-white in colour.” The visible minority population consists mainly of the following groups: South Asian, Chinese, Black, Filipino, Arab, Latin American, Southeast Asian, West Asian, Korean and Japanese.
First generation: Refers to a person born outside Canada. They are usually immigrants or non-permanent residents, but not always (for example, someone born outside Canada to parents who are Canadian citizens would be first generation but would have Canadian citizenship at birth and not be an immigrant).
Second generation: Refers to a person who was born in Canada and has at least one parent born outside Canada.
Third generation or more: Refers to a person born in Canada whose parents were both born in Canada.
Economic immigrant: Refers to an immigrant who has been selected for their ability to contribute to Canada’s economy through their ability to meet labour market needs, to own and manage or to build a business, to make a substantial investment, to create their own employment or to meet specific provincial or territorial labour market needs.
Family class immigrant: Refers to an immigrant who was sponsored by a Canadian citizen or permanent resident and was granted permanent resident status on the basis of their relationship either as the spouse, partner, parent, grandparent, child or other relative of this sponsor.
Refugee: Refers to an immigrant who was granted permanent resident status on the basis of a well-founded fear of returning to their home country. This category includes persons who had a well-founded fear of persecution for reasons of race, religion, nationality, membership in a particular social group or for political opinion (Geneva Convention refugees) as well as persons who had been seriously and personally affected by civil war or armed conflict, or have suffered a massive violation of human rights. Some refugees were in Canada when they applied for refugee protection for themselves and their family members (either with them in Canada or abroad). Others were abroad and were referred for resettlement to Canada by the United Nations Refugee Agency, another designated referral organization or private sponsors.
Bachelor’s degree or higher: This includes bachelor’s, master’s and doctoral degrees; degrees in medicine, dentistry, optometry or veterinary medicine; and university certificates and diplomas that have a bachelor’s degree as a prerequisite.
Please refer to the Dictionary, Census of Population, 2021, Catalogue no. 98-301-X2021001, for additional information on the census variables.
Overqualification: For the purposes of this paper, a person is overqualified if they have a bachelor’s degree or higher and are working in an occupation that typically requires at most a high school diploma. This refers to occupations in Training, Education, Experience and Responsibilities (TEER) categories 4 or 5 in the National Occupational Classification 2021. People in managerial occupations (TEER 0) are excluded from the calculation.
References
Boyd, Monica. 2017. “Closing the open door? Canada’s changing policy for migrant caregivers.” In Gender, Migration, and the Work of Care: A Multi-Scalar Approach to the Pacific Rim, ed. Sonya Michel and Ito Peng, 167-189. Springer International Publishing.
Chen, Wen-Hao and Feng Hou. 2019. “Intergenerational Education Mobility and Labour Market Outcomes: Variation Among the Second Generation of Immigrants in Canada.” Analytical Studies Branch Research Paper Series, no. 418. Statistics Canada Catalogue no. 11F0019M.
Childs, Stephen, Ross Finnie and Richard E. Mueller. 2015 “Why do so many children of immigrants attend university? Evidence for Canada.” Journal of International Migration and Integration 18:1. September.
Cornelissen, Louis and Martin Turcotte. 2020. “Persistent overqualification among immigrants and non-immigrants.” Insights on Canadian Society. September. Statistics Canada Catalogue no. 75-006-X.
Hou, Feng. 2020. “The resettlement of Vietnamese refugees across Canada over three decades.” Journal of Ethnic and Migration Studies. 1-18.
Houle, René and Lahouaria Yssaad. 2010. “Recognition of newcomers’ foreign credentials and work experience.” Perspectives on Labour and Income. Vol. 11, no. 9. Statistics Canada Catalogue no. 75-001-X. p. 19–36.
Krahn, Harvey and Alison Taylor. 2005. “Resilient teenagers: explaining the high educational aspirations of visible-minority youth in Canada.” Journal of International Migration and Integration 6:3/4. Summer/Fall. 405-434.
Martin, Philip, Manolo Abella, and Elizabeth Midgley. 2004. “Best Practices to Manage Migration: The Philippines.” The International Migration Review. Vol. 38, no. 4. p. 1544–1560.
Pratt, Geraldine. 2008. “Deskilling Across the Generations: Reunification among Transnational Filipino Families in Vancouver.” Philippine Women Centre of British Columbia, Working Paper Series, 08-06. Metropolis British Columbia.
Statistics Canada. “Canada’s Black population: Education, labour and resilience.” 2020. Ethnicity, Language and Immigration Thematic Series. 25 February. Statistics Canada Catalogue no 89-657-X2020002.
- Date modified: