
Guide to the Census of Population, 2016
Appendix 1.8 – Evaluation of the impact of updating 2016 Census language data
After Statistics Canada was notified of anomalies, for various regions in Quebec, in the 2016 Census language data released on August 2, it conducted an in-depth investigation to identify their source.
During the census, Statistics Canada follows up with households that partially completed the census questionnaire. For the 2016 Census, Statistics Canada developed a computer program to perform certain steps of this operation. An error was identified in this computer program that affected French-language questionnaires.
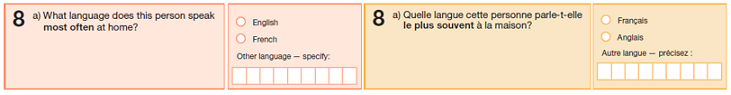
The census language questions are the only questions for which response options differ between the French and English versions. The French version of the census questionnaire has given precedence to French in the wording of the questions and the response options. This only affects census questions on mother tongue, language spoken at home and knowledge of official languages. The example below illustrates this difference with respect to language spoken most often at home. This distinction was not taken into account by the new computer program used for partial non-response follow-up in 2016.
Description for Figure
This bilingual figure shows Question 8 a) from the 2016 Census of Population questionnaire. The left portion of the figure displays the question in English which asks "What language does this person speak most often at home." The answer categories are "English; French; Other language – specify." The right portion of the figure displays the question in French which asks "Quelle langue cette personne parle-t-elle le plus souvent à la maison." The answer categories are "Français; Anglais; Autre langue – précisez."
The resulting error led to incorrect allocation of responses to the census language questions for roughly 61,000 individuals, mainly in Quebec. It resulted in an overestimation of the growth of English in Quebec between 2011 and 2016, both as a mother tongue and as a language spoken at home.
After correcting these allocation errors, Statistics Canada conducted an in-depth review to ensure that no other census questions were affected by an error and that the computer programs did not affect other variables. Moreover, Statistics Canada extensively reviewed the many data editing and control stages.
The results of this analysis and the corrective steps taken are described below.
Potential impact on other variables
Following the detection of the language allocation error, Statistics Canada conducted a review to determine if the error negatively impacted the quality of estimates for any other variables. After a thorough review of systems, programs and estimation procedures, Statistics Canada concluded that the impact on the estimates for all other variables was negligible.
For the 2016 Census variables, the vast majority of responses were received directly from respondents either on the census questionnaire or through a record linkage to administrative files. For example, 99% of place of birth responses came directly from respondents and 95% of income values came from high-quality administrative data (including tax data from the Canada Revenue Agency).Note 1Note 2 The incorrect allocation of responses to the language variables could only potentially affect estimates for the remaining records which required imputation through the donor imputation process. In that process, a respondent's missing or invalid values (the recipient) are replaced from other respondents with similar characteristics (the donor). The incorrect allocation of responses to the language variables could affect the estimates for that record in one of two ways:
- A recipient record with a miscoded language is imputed with a donor. It could be that a donor with a different value would have been chosen had the recipient's language been coded correctly.
- A recipient record with a correctly coded language is imputed with a donor. It could be that a donor was incorrectly chosen, based partly upon the donor having a miscoded language.
In this donor imputation process, donors are chosen by a score which reflects their similarity to the recipient. Usually, a donor is randomly chosen from among several similarly qualified donors. It is important to underscore that this random selection causes variability in the donor imputation process, and any re-running of the donor imputation system could result in slightly different estimates due to this variability.
Statistics Canada conducted an analysis to determine whether the language error affected the results of the donor imputation process. To begin with, the potential effect of the language error would be considerably mitigated by the following factors:
- Not all variables used language variables to select donors for imputation. Income, immigration, ethnocultural, Aboriginal, mobility and migration, and language of work were the only topics which used language variables in their imputation processes. Age and sex, dwelling type, families, marital status, and living arrangements were not affected since language variables (or any of the variables listed above) were not used to select donors for imputation.
- Very few imputed cases were affected by the language allocation error. As shown in Table 1, most of the variables which used language to select donors were imputed fewer than 1,000 times among the affected cases.
- The affected records were concentrated in Quebec but not in any particular municipality (census subdivision or CSD); rather, they were distributed among many municipalities.
- Language is only one of several variables used in the donor imputation process. Depending on which variables are being imputed, the donor selection variables can include age, sex, geography, variables from linked administrative data (e.g., place of birth from linked immigration administrative records), other variables (e.g., immigrant status), and language. A recipient's characteristics are matched as closely as possible to a donor's characteristics across all of these dimensions. Because many dimensions are used, the importance of an error in any one dimension is significantly reduced.
- For most variables, language is primarily a useful donor selection variable when it differentiates between immigrant languages, Aboriginal languages and official languages. Because the language allocation error was specific to miscoding between the two official languages, the importance of the error is smaller than if it had affected immigrant or Aboriginal languages.
- Donors that are a close match on other characteristics will also tend to have similar or equal information for the variables being imputed, reducing the impact of using a different donor.
| Variable | Question | Number of affected records imputed | Percentage of total population (%) |
|---|---|---|---|
| Canada | |||
| Income | Linked administrative data | 1,940 | 0.01 |
| Place of birth | Q12 | 340 | 0.00 |
| Citizenship | Q13 | 300 | 0.00 |
| Immigrant status | Q14 | 250 | 0.00 |
| Year of immigration | Q15 | 410 | 0.00 |
| Admission category | Linked administrative data | 160 | 0.00 |
| Ethnic origin | Q17 | 2,220 | 0.03 |
| Aboriginal group | Q18 | 610 | 0.01 |
| Visible minority | Q19 | 1,000 | 0.01 |
| Registered or Treaty Indian status | Q20 | 620 | 0.01 |
| Membership in a First Nation or Indian band | Q21 | 790 | 0.01 |
| Mobility status, one year | Q22 | 910 | 0.01 |
| Mobility status, five years | Q23 | 980 | 0.01 |
| Place of birth of father | Q24a | 630 | 0.01 |
| Place of birth of mother | Q24b | 690 | 0.01 |
| Language of work | Q45 | 710 | 0.01 |
| Quebec | |||
| Income | Linked administrative data | 1,760 | 0.02 |
| Place of birth | Q12 | 320 | 0.02 |
| Citizenship | Q13 | 280 | 0.01 |
| Immigrant status | Q14 | 230 | 0.01 |
| Year of immigration | Q15 | 370 | 0.02 |
| Admission category | Linked administrative data | 150 | 0.01 |
| Ethnic origin | Q17 | 2,070 | 0.11 |
| Aboriginal group | Q18 | 580 | 0.03 |
| Visible minority | Q19 | 930 | 0.05 |
| Registered or Treaty Indian status | Q20 | 560 | 0.03 |
| Membership in a First Nation or Indian band | Q21 | 740 | 0.04 |
| Mobility status, one year | Q22 | 840 | 0.04 |
| Mobility status, five years | Q23 | 910 | 0.05 |
| Place of birth of father | Q24a | 580 | 0.03 |
| Place of birth of mother | Q24b | 640 | 0.03 |
| Language of work | Q45 | 650 | 0.03 |
|
Note: The number of records imputed is unweighted and rounded. The percentages of the total population were calculated based on weighted estimates for all variables except income. Source: Statistics Canada, Census of Population, 2016. |
|||
The analysis involved re-running certain steps of the imputation process, first, to assess the amount of variability in estimates arising from the imputation process itself, and second, to assess the size of the change arising from re-imputing the cases affected by the language allocation errors. If the size of the change arising from re-imputing the cases affected by the language allocation error was small relative to the variability in estimates arising from the imputation process itself, then it could be concluded that the impact of the language allocation error on the estimates was negligible.
Table 2 illustrates the variability introduced to the estimates by the imputation system overall.Note 3 The table focusses on results from Quebec, where most of the affected cases were found. It focusses only on variables for which language variables were used to select donors during imputation. It shows results averaged across CSDs according to size, for selected income and ethnocultural indicators (median total income, median wages, proportion of the population with Aboriginal identity, proportion of visible minorities, proportion of immigrants, and proportion with British Isles ethnic originsNote 4).Note 5 When the data are re-imputed for all CSDs, these estimates may rise or fall. For example, for a CSD in the population range of 20,000 to 99,999, when the total income value increased, it increased by an average of $16, and when it decreased it decreased by an average of $15. This is an illustration of the small variability in the estimate that derives from donor imputation.
Table 3 shows what would be the effect of correcting only those records whose language allocation changed.Note 6 For CSDs in this size class, in cases where the income estimate rose, it rose by $3 on average; and in cases where it fell, it fell by $4 on average. Thus, the change in estimates resulting from correcting the language error and re-imputing the results is small and falls within the variability inherent in the imputation process, and therefore has a negligible impact on the results. This was also true for different CSD size classes and for other variables which used language variables to select donors during imputation.Note 7
The analysis of the potential impact of the language allocation error on estimates for the other variables from the 2016 Census concluded that the error had a very negligible impact. This was to be expected, given that the vast majority of records received responses directly from respondents or linked administrative records, and very few respondents had estimates that were affected by the language allocation error.
However, in some cases, the mother tongue, home language, or knowledge of official language variables were used to deterministically modify inconsistent responses related to the language of work and knowledge of non-official languages variables (e.g., if an individual reports that they speak Spanish most often at home, Spanish must also be one of the responses provided for the knowledge of non-official languages). Because of this direct dependence, the language of work and knowledge of non-official languages variables were re-processed for the 2016 Census using the corrected the mother tongue, home language, and knowledge of official language variables.
Based upon these results, there was no need to re-process any non-language variables for the 2016 Census.
| CSD population size | Values from one imputation | Values from another imputation | Average imputation effect | Average of positive effects | Average of negative effects |
|---|---|---|---|---|---|
| Median total income ($) | |||||
| 250 to 9,999 | 30,128 | 30,129 | −3 | 69 | −67 |
| 10,000 to 19,999 | 36,958 | 36,952 | −10 | 20 | −22 |
| 20,000 to 99,999 | 36,478 | 36,477 | −5 | 16 | −15 |
| 100,000+ | 34,469 | 34,468 | 2 | 13 | −8 |
| Median wages and salaries ($) | |||||
| 250 to 9,999 | 28,534 | 28,530 | 2 | 97 | −96 |
| 10,000 to 19,999 | 35,725 | 35,722 | −1 | 29 | −32 |
| 20,000 to 99,999 | 35,606 | 35,607 | −2 | 12 | −16 |
| 100,000+ | 33,957 | 33,955 | 1 | 6 | −5 |
| Proportion with Aboriginal identity (%) | |||||
| 250 to 9,999 | 7.0 | 7.0 | 0.00 | 0.20 | −0.30 |
| 10,000 to 19,999 | 2.1 | 2.1 | 0.00 | 0.04 | −0.06 |
| 20,000 to 99,999 | 1.3 | 1.3 | 0.00 | 0.02 | −0.01 |
| 100,000+ | 1.6 | 1.6 | 0.00 | 0.01 | 0.00 |
| Proportion of visible minorities (%) | |||||
| 250 to 9,999 | 0.8 | 0.8 | 0.00 | 0.15 | −0.18 |
| 10,000 to 19,999 | 4.5 | 4.5 | 0.00 | 0.01 | −0.01 |
| 20,000 to 99,999 | 6.2 | 6.2 | 0.00 | 0.01 | −0.01 |
| 100,000+ | 10.3 | 10.3 | 0.00 | 0.00 | 0.00 |
| Proportion of immigrants (%) | |||||
| 250 to 9,999 | 2.6 | 2.6 | 0.00 | 0.15 | −0.23 |
| 10,000 to 19,999 | 9.0 | 9.0 | 0.00 | 0.00 | −0.01 |
| 20,000 to 99,999 | 10.5 | 10.5 | 0.00 | 0.01 | −0.01 |
| 100,000+ | 14.5 | 14.5 | 0.00 | 0.00 | 0.00 |
| Proportion with British Isles ethnic origins (%) | |||||
| 250 to 9,999 | 8.4 | 8.4 | 0.00 | 0.39 | −0.40 |
| 10,000 to 19,999 | 11.7 | 11.7 | 0.02 | 0.09 | −0.09 |
| 20,000 to 99,999 | 8.7 | 8.7 | 0.01 | 0.07 | −0.05 |
| 100,000+ | 8.0 | 8.0 | 0.00 | 0.02 | −0.01 |
|
Note: The analysis is on CSDs with a population of 250 or more persons. Cells represent the average value among CSDs in each size range. Population in private households only. For income variables, the analysis is restricted to the population living in private dwellings aged 15 years and older. For the ethnocultural variables, the analysis is restricted to the population living in private dwellings and to persons not in census families, lone parents, and persons in couples (with or without children). Source: Statistics Canada, Census of Population, 2016, experimental analysis. |
|||||
| CSD population size | Expected value (before correcting language error) | Expected value (after correcting language error) | Average change | Average of positive changes | Average of negative changes |
|---|---|---|---|---|---|
| Median total income ($) | |||||
| 250 to 9,999 | 30,133 | 30,129 | −3 | 24 | −31 |
| 10,000 to 19,999 | 36,957 | 36,955 | −2 | 3 | −6 |
| 20,000 to 99,999 | 36,477 | 36,477 | 0 | 3 | −4 |
| 100,000+ | 34,470 | 34,469 | 0 | 2 | −1 |
| Median wages and salaries ($) | |||||
| 250 to 9,999 | 28,535 | 28,536 | 1 | 44 | −41 |
| 10,000 to 19,999 | 35,726 | 35,726 | 0 | 8 | −8 |
| 20,000 to 99,999 | 35,609 | 35,607 | −2 | 5 | −6 |
| 100,000+ | 33,955 | 33,956 | 0 | 3 | −2 |
| Proportion with Aboriginal identity (%) | |||||
| 250 to 9,999 | 7.0 | 7.0 | 0.00 | 0.17 | −0.07 |
| 10,000 to 19,999 | 2.1 | 2.1 | 0.00 | 0.01 | 0.00 |
| 20,000 to 99,999 | 1.3 | 1.3 | 0.00 | 0.01 | −0.01 |
| 100,000+ | 1.6 | 1.6 | 0.00 | 0.00 | 0.00 |
| Proportion of visible minorities (%) | |||||
| 250 to 9,999 | 0.8 | 0.8 | 0.00 | 0.08 | 0.00 |
| 10,000 to 19,999 | 4.5 | 4.5 | 0.00 | 0.00 | −0.01 |
| 20,000 to 99,999 | 6.2 | 6.2 | 0.00 | 0.00 | 0.00 |
| 100,000+ | 10.3 | 10.3 | 0.00 | 0.00 | 0.00 |
| Proportion of immigrants (%) | |||||
| 250 to 9,999 | 2.6 | 2.6 | 0.00 | 0.13 | −0.06 |
| 10,000 to 19,999 | 9.0 | 9.0 | 0.00 | 0.00 | −0.01 |
| 20,000 to 99,999 | 10.5 | 10.5 | 0.00 | 0.00 | 0.00 |
| 100,000+ | 14.5 | 14.5 | 0.00 | 0.00 | 0.00 |
| Proportion with British Isles ethnic origins (%) | |||||
| 250 to 9,999 | 8.4 | 8.4 | −0.02 | 0.25 | −0.30 |
| 10,000 to 19,999 | 11.7 | 11.7 | −0.02 | 0.02 | −0.06 |
| 20,000 to 99,999 | 8.7 | 8.7 | −0.01 | 0.02 | −0.02 |
| 100,000+ | 8.0 | 8.0 | −0.01 | 0.01 | −0.01 |
|
Note: The analysis is on CSDs with a population of 250 or more persons. Cells represent the average value among CSDs in each size range. Population in private households only. For income variables, the analysis is restricted to the population living in private dwellings aged 15 years and older. For the ethnocultural variables, the analysis is restricted to the population living in private dwellings and to persons not in census families, lone parents, and persons in couples (with or without children). Source: Statistics Canada, Census of Population, 2016, experimental analysis. |
|||||
Evaluation of the impact on the weighting of the 2016 Census long-form questionnaire sample
The purpose of the weighting for the census long-form questionnaire sample is to be able to extrapolate the results of the sample to the entire population. The weighting is based on several characteristics that were collected for the entire population. More specifically, the weight of households in the long-form sample is calculated so that the sum of these household weights corresponded to the population counts for several characteristics. This technique is called weight calibration.
Weight calibration establishes consistency and decreases the variance among the estimates for the long-form questionnaire characteristics correlated with the calibration characteristics. Weight calibration is done independently for geographic areas called weighting areas.Note 8 Up to 200 population characteristics can be used to perform weight calibration within a weighting area. On average, approximately 100 are used.
Among the characteristics affected by the language data error, only the "knowledge of official languages" characteristic (i.e., English only, French only, English and French, Neither English nor French) was used for calibration. Corrections to the language data were made for approximately 61,000 people. However, the "knowledge of official languages" data did not require corrections for all of these individuals. Corrections to the "knowledge of official languages" data were made for a little over 36,000 people, the vast majority (95%) of whom went from the category "English and French" to "French only." Since these corrections concerned mostly people with a knowledge of French, they were more significant in certain geographic areas of Quebec.
Estimates from the weighting areas most affected by these corrections were evaluated. The original weights were calculated based on the "knowledge of official languages" data before the corrections. The evaluation determined whether these weights could be used to produce accurate long-form characteristic estimates in terms of bias and sampling variance. The impact on the estimates is more easily detected for variables correlated with "knowledge of official languages," such as sociocultural variables or other variables involving languages that were not used in calibration.
"Mother tongue" data (i.e., English, French or another language), which were available for the entire population, were used as a test variable to study the impact on the accuracy of estimates. This variable is correlated with "knowledge of official languages," and was a variable that required correction. Estimates for the four weighting areas most affected by the corrections were produced for the two "mother tongue" categories most affected (i.e., French and English), after correcting this characteristic. Estimates were produced first using the original weights, then using the weights calibrated to the corrected "knowledge of official languages" data, as well as to the other characteristics used to calculate the original weights.Note 9
To study the impact on the bias of estimates, t-statistics (i.e., the difference between the total estimate and the population count, divided by the standard error of the total estimate) were calculated using the two weight sets. Then, a t-statistic was calculated for the difference between the two estimates (i.e., the estimate with the original weight minus the estimate with the corrected weight, divided by the standard error of this difference). Table 4 shows all the t-statistics.
| Mother tongue | Predominant city in the weighting area | T-statistic | ||
|---|---|---|---|---|
| Difference between the estimate with original weights and population count | Difference between the estimate with corrected weights and population count | Difference between the two estimates | ||
| French | Coaticook | 1.92 | 1.75 | 1.62 |
| English | Coaticook | −0.51 | −0.31 | −1.49 |
| French | Rivière-du-Loup | 1.15 | 1.02 | 0.93 |
| English | Rivière-du-Loup | −0.87 | −0.72 | −0.99 |
| French | Trois-Rivières | −0.79 | −0.80 | 0.24 |
| English | Trois-Rivières | −0.41 | −0.37 | −0.63 |
| French | Drummondville | 1.55 | 1.64 | −1.19 |
| English | Drummondville | −0.60 | −0.70 | 1.30 |
| Source: Statistics Canada, Census of Population, 2016, experimental analysis. | ||||
The absolute values of the t-statistics on the estimates based on the original weights and of those based on the corrected weights are less than 2. This is an indication that the estimates are not biased, regardless of the weight set used. The absolute values of the t-statistics based on the differences between the two estimates are also less than 2. This indicates that the two estimates are not significantly different.
To evaluate the impact on the sampling variance of estimates, the standard errors were calculated based on the two weighting scenarios. The results are shown in Table 5.
| Mother tongue | Predominant city in the weighting area | Standard errors | |
|---|---|---|---|
| Estimate with original weights | Estimate with corrected weights | ||
| French | Coaticook | 166 | 163 |
| English | Coaticook | 140 | 137 |
| French | Rivière-du-Loup | 87 | 85 |
| English | Rivière-du-Loup | 60 | 59 |
| French | Trois-Rivières | 137 | 137 |
| English | Trois-Rivières | 92 | 91 |
| French | Drummondville | 101 | 101 |
| English | Drummondville | 72 | 72 |
| Source: Statistics Canada, Census of Population, 2016, experimental analysis. | |||
The standard errors calculated with the corrected weights are very similar to the standard errors calculated with the original weights. This indicates that using the original weights would not negatively affect the sampling variance of the estimates.
Mother tongue estimates were calculated after the data were corrected for the weighting areas most affected. The evaluation of these calculations shows that using the original weights does not change the accuracy of the estimates in terms of bias and sampling variance. In the geographic areas with fewer corrections, the impact of the corrections should be even less noticeable. Like the other characteristics used in calibration, "knowledge of official languages" was not systematically chosen in all the weighting areas. Based on the evaluation results above, correcting the weights is not necessary to ensure the accuracy of the estimates produced with the long-form questionnaire sample.
Notes
- Date modified: